Exam 6: Statistical Methods in Quality Management
Exam 1: Introduction to Quality80 Questions
Exam 2: Foundations of Quality Management80 Questions
Exam 3: Customer Focus80 Questions
Exam 4: Workforce Focus80 Questions
Exam 5: Process Focus79 Questions
Exam 6: Statistical Methods in Quality Management95 Questions
Exam 7: Design for Quality and Product Excellence80 Questions
Exam 8: Measuring and Controlling Quality104 Questions
Exam 9: Process Improvement and Six Sigma80 Questions
Exam 10: The Baldrige Framework for Performance Excellence80 Questions
Exam 11: Strategy and Performance Excellence78 Questions
Exam 12: Measurement and Knowledge Management for Performance Excellence80 Questions
Exam 13: Leadership for Performance Excellence80 Questions
Exam 14: Building and Sustaining Quality and Performance Excellence77 Questions
Select questions type
_____ is a methodology for drawing conclusions about equality of means of multiple populations.
(Multiple Choice)
4.8/5  (33)
(33)
The Histogram tool provides the basic statistical measures of location,dispersion,and shape.
(True/False)
4.8/5 (37)
A sample of size 16 is randomly selected from a population of size 90.Determine the standard error of the mean if the population standard deviation equals 20.
(Multiple Choice)
4.8/5 (42)
In which of the following companies,a high level of soldering defects was observed,necessitating 100 percent inspection for all circuit boards?
(Multiple Choice)
4.8/5 (36)
Based on a _____-step process flowchart,it was decided that the analysis would require the use of a moderately complex experimental design in the Six Sigma project.
(Multiple Choice)
4.8/5 (37)
Correlation is a measure of a linear or a non-linear relationship between two variables.
(True/False)
4.8/5 (28)
The Data Validation Toolpak in Microsoft Excel for Windows provides many procedures for conducting statistical analyses.
(True/False)
4.7/5 (32)
Define binomial and Poisson distributions.State their probability functions.
(Essay)
4.8/5 (35)
The probability density function for the normal distribution is, 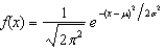
 .
.
(True/False)
4.9/5 (33)
Products are boxed in groups of 25.Drawing a sample of boxes and inspecting all units in the boxes selected is an example of systematic sampling.
(True/False)
4.9/5 (39)
The times (in minutes) required by a sample of 15 students to complete a class assigment are given below:
45,42,56,54,40,37,39,45,49,43,45,50,49,55,48
Using Excel functions and calculate the mean,median,mode,range,sample variance,and sample standard deviation.
(Essay)
4.8/5 (36)
Partitioning a population into hierarchical groups or levels,and selecting a sample from each group is known as:
(Multiple Choice)
4.8/5 (39)
Suppose that a scatter diagram depicts a relationship between the two variables that can be summarized by a straight line.The correlation coefficient is computed and results in a value of -0.73.Which of the following is NOT TRUE?
(Multiple Choice)
4.9/5 (37)
In a designed experiment,a(n) _____ measures the difference that a factor has on the response.
(Multiple Choice)
4.8/5 (35)
As the sample size increases,the standard error of the mean increases,all else being held constant.
(True/False)
4.8/5 (30)
What are the rules that apply when calculating probabilities of events?
(Essay)
4.8/5 (37)
Filters
- Essay(0)
- Multiple Choice(0)
- Short Answer(0)
- True False(0)
- Matching(0)