Exam 6: Statistical Methods in Quality Management
Exam 1: Introduction to Quality80 Questions
Exam 2: Foundations of Quality Management80 Questions
Exam 3: Customer Focus80 Questions
Exam 4: Workforce Focus80 Questions
Exam 5: Process Focus79 Questions
Exam 6: Statistical Methods in Quality Management95 Questions
Exam 7: Design for Quality and Product Excellence80 Questions
Exam 8: Measuring and Controlling Quality104 Questions
Exam 9: Process Improvement and Six Sigma80 Questions
Exam 10: The Baldrige Framework for Performance Excellence80 Questions
Exam 11: Strategy and Performance Excellence78 Questions
Exam 12: Measurement and Knowledge Management for Performance Excellence80 Questions
Exam 13: Leadership for Performance Excellence80 Questions
Exam 14: Building and Sustaining Quality and Performance Excellence77 Questions
Select questions type
The Poisson distribution is closely related to the binomial distribution.
(True/False)
4.9/5  (37)
(37)
Which of the following constitutes an approach to reducing sampling error?
(Multiple Choice)
5.0/5 (36)
A _____ can take on any real value over a specified interval of real numbers.
(Multiple Choice)
4.8/5 (29)
All else being equal,as the confidence level increases,the confidence interval becomes larger
to provide higher levels of assurance that the interval contains the true population parameter.
(True/False)
4.9/5 (38)
What was the primary hypothesis stated by the team? What is the additional hypothesis investigated?
(Essay)
4.7/5 (33)
The team identified _____ characteristics (Xs,or independent variables) that were considered important to measure during the experiment for each of the _____ finish types (Ys,or dependent variables).
(Multiple Choice)
4.8/5 (31)
Using _____,it was observed that bath temperature,wave height,and omega had a significant effect on the soldering defects.
(Multiple Choice)
4.8/5 (30)
Which of the following is NOT a tool for descriptive statistics?
(Multiple Choice)
4.7/5 (37)
Briefly discuss the relation between exponential distribution and Poisson distribution with an example.
(Essay)
4.8/5 (32)
Three scatter diagrams are given below.How many of the diagrams present data that can be described by a linear relationship and,therefore,justifiably summarized by the correlation coefficient?
Plot A 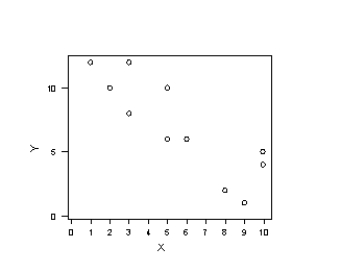 Plot B
 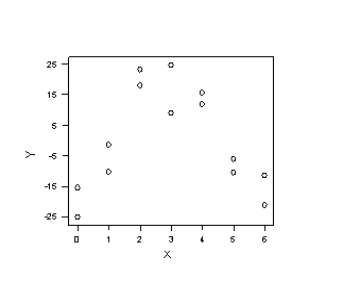 Plot C
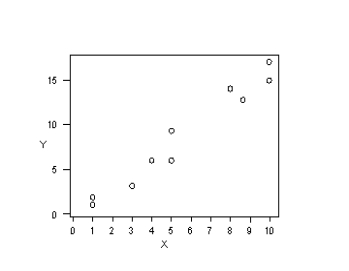
(Multiple Choice)
4.8/5 (31)
If a normal random variable has a mean  = _____ and a standard deviation
  = _____,it is called a standard normal distribution.
(Multiple Choice)
4.8/5 (22)
A frequency distribution is a table that shows the number of observations in each of several nonoverlapping groups.
(True/False)
4.8/5 (34)
Distributions with values of coefficient of kurtosis (CK) greater than 3 are more flat with a wide degree of dispersion.
(True/False)
4.8/5 (26)
A manager was assigned the task of investigating the error in payments for routine purchases made by the purchasing department.The manager randomly selected 12 payments,investigated them thoroughly,and determined the payment error for each of these payments.The payment error was defined as the difference between the amount paid and what should have been paid.The payment errors determined for these selected payments were as follows:
 a.What is the 95% confidence interval for the population mean payment error?
b.Suppose a recent company report inferred that the mean payment error may be running as high as $25.That led the manager to test the null hypothesis that the population mean payment error is equal to $25 versus the alternative that the population mean payment error is not equal to $25.Using a level of significance equal to 0.01,perform this hypothesis test.
c.Suppose another manager used this same data to test the null hypothesis that the population mean payment error is less than or equal to $15 versus the alternative that the population mean payment error is greater than $15.What is the test statistic for this hypothesis testing situation? What is the critical value at a level of significance equal to 0.01? What is the conclusion?
a.What is the 95% confidence interval for the population mean payment error?
b.Suppose a recent company report inferred that the mean payment error may be running as high as $25.That led the manager to test the null hypothesis that the population mean payment error is equal to $25 versus the alternative that the population mean payment error is not equal to $25.Using a level of significance equal to 0.01,perform this hypothesis test.
c.Suppose another manager used this same data to test the null hypothesis that the population mean payment error is less than or equal to $15 versus the alternative that the population mean payment error is greater than $15.What is the test statistic for this hypothesis testing situation? What is the critical value at a level of significance equal to 0.01? What is the conclusion?
(Essay)
4.8/5 (42)
The collection of all possible outcomes of an experiment is called an event.
(True/False)
4.8/5 (35)
In a factorial experiment,each combination of different levels of the factor is called a(n) _____.
(Multiple Choice)
4.7/5 (26)
A perfume bottle is designed to have a capacity of 15 ounces.There is variation in the bottle manufacturing process.Based on historical data,let's suppose that the bottle capacity can be reasonably modeled by a normal distribution with a mean of 15 ounces and a standard deviation of 0.2 ounces.What proportion of these bottles will have a capacity between 14.7 and 15.1 ounces?
(Multiple Choice)
4.8/5 (32)
Given here are a set of sample data: 12.0,18.3,29.6,14.3,and 27.8.The sample standard deviation for this data is equal to _____.
(Multiple Choice)
4.8/5 (34)
Filters
- Essay(0)
- Multiple Choice(0)
- Short Answer(0)
- True False(0)
- Matching(0)