Exam 4: Describing Data: Displaying and Exploring Data
Exam 1: What Is Statistics79 Questions
Exam 2: Describing Data: Frequency Tables, Frequency Distributions, and Graphic Presentation129 Questions
Exam 3: Describing Data: Numerical Measures132 Questions
Exam 4: Describing Data: Displaying and Exploring Data108 Questions
Exam 5: A Survey of Probability Concepts130 Questions
Exam 6: Discrete Probability Distributions128 Questions
Exam 7: Continuous Probability Distributions131 Questions
Exam 8: Sampling Methods and the Central Limit Theorem115 Questions
Exam 9: Estimation and Confidence Intervals129 Questions
Exam 10: One-Sample Tests of Hypothesis134 Questions
Exam 11: Two-Sample Tests of Hypothesis130 Questions
Exam 12: Analysis of Variance128 Questions
Exam 13: Correlation and Linear Regression130 Questions
Exam 14: Multiple Regression Analysis129 Questions
Exam 15: Index Numbers129 Questions
Exam 16: Time Series and Forecasting129 Questions
Exam 17: Nonparametric Methods: Goodness-Of-Fit Tests129 Questions
Exam 18: Nonparametric Methods: Analysis of Ranked Data129 Questions
Exam 19: Statistical Process Control and Quality Management129 Questions
Exam 20: An Introduction to Decision Theory115 Questions
Select questions type
A dot plot is useful for quickly graphing frequencies in a small data set.
(True/False)
4.9/5  (34)
(34)
For the following data, are any of the observations an outlier? 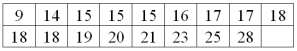
(Short Answer)
4.9/5 (29)
In a distribution, the second quartile corresponds with the
(Multiple Choice)
4.8/5 (27)
What statistic can be used to measure the relative symmetry of a distribution? ___________________________________
(Short Answer)
4.8/5 (29)
A relationship between gender and preference for Coke or Pepsi can be best represented by a scatter diagram.
(True/False)
4.9/5 (33)
A student scored in the 85th percentile on a standardized test. This means that the student scored lower than 85% of all students who took the test.
(True/False)
4.7/5 (45)
In a stem-and-leaf display, the leaf represents a class of a frequency distribution.
(True/False)
4.9/5 (37)
In a positively skewed distribution, the 50th percentile is the same as the _______________.
(Short Answer)
4.9/5 (29)
To locate the percentile for a given observation in a data set, the data must be
(Multiple Choice)
4.7/5 (37)
What chart or graph uses dots to show frequencies? ________________
(Short Answer)
4.9/5 (38)
For the following data, how many observations are in the data? 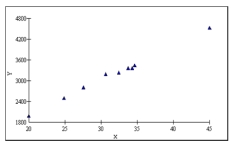
(Short Answer)
4.8/5 (23)
What is the value of the Pearson coefficient of skewness for a distribution with a mean of 17, median of 12 and standard deviation of 6?
(Multiple Choice)
4.9/5 (27)
Filters
- Essay(0)
- Multiple Choice(0)
- Short Answer(0)
- True False(0)
- Matching(0)