Exam 4: Describing Data: Displaying and Exploring Data
Exam 1: What Is Statistics79 Questions
Exam 2: Describing Data: Frequency Tables, Frequency Distributions, and Graphic Presentation129 Questions
Exam 3: Describing Data: Numerical Measures132 Questions
Exam 4: Describing Data: Displaying and Exploring Data108 Questions
Exam 5: A Survey of Probability Concepts130 Questions
Exam 6: Discrete Probability Distributions128 Questions
Exam 7: Continuous Probability Distributions131 Questions
Exam 8: Sampling Methods and the Central Limit Theorem115 Questions
Exam 9: Estimation and Confidence Intervals129 Questions
Exam 10: One-Sample Tests of Hypothesis134 Questions
Exam 11: Two-Sample Tests of Hypothesis130 Questions
Exam 12: Analysis of Variance128 Questions
Exam 13: Correlation and Linear Regression130 Questions
Exam 14: Multiple Regression Analysis129 Questions
Exam 15: Index Numbers129 Questions
Exam 16: Time Series and Forecasting129 Questions
Exam 17: Nonparametric Methods: Goodness-Of-Fit Tests129 Questions
Exam 18: Nonparametric Methods: Analysis of Ranked Data129 Questions
Exam 19: Statistical Process Control and Quality Management129 Questions
Exam 20: An Introduction to Decision Theory115 Questions
Select questions type
If the coefficient of skewness is equal to zero, the shape of the distribution is
(Multiple Choice)
4.8/5  (29)
(29)
The following stem and leaf display reports the number of boats shipped per week by Ottertail Boats, Inc.
11| 1 5 9
12| 0 1 2 2 6 9
13| 0 1 2 3 4 5 5 7 8 8 9
14| 2 6 8
15| 0 1 2 4 5 7 8 9
16| 1 5 7 9
How often did the company ship 111 boats in a week? ____________
(Short Answer)
4.9/5 (22)
A telemarketing firm is monitoring the performance of its employees based on the number of sales per hour. One employee had the following sales for the last 20 hours. 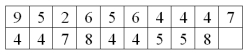 What is the median for the distribution of number of sales per hour? ____________
(Short Answer)
4.7/5 (32)
A stem-and-leaf display includes the following row: 3 | 0 1 3 5 7 9. Assume that the data is rounded to the nearest whole number.
(Multiple Choice)
4.8/5 (35)
A scatter diagram of sales versus production is labeled with sales on the Y-axis and production on the X-axis.
(True/False)
4.9/5 (40)
Pearson's coefficient of skewness is a measure of a distribution's symmetry.
(True/False)
4.8/5 (33)
If the mean of a distribution is smaller than the median and mode, what is the sign of Pearson's coefficient of skewness? _______________
(Short Answer)
4.7/5 (34)
The following stem and leaf display reports the number of boats shipped per week by Ottertail Boats, Inc.
11| 1 5 9
12| 0 1 2 2 6 9
13| 0 1 2 3 4 5 5 7 8 8 9
14| 2 6 8
15| 0 1 2 4 5 7 8 9
16| 1 5 7 9
How many observations are in the third class? ___________
(Short Answer)
4.7/5 (35)
The following stem and leaf display reports the number of boats shipped per week by Ottertail Boats, Inc.
11| 1 5 9
12| 0 1 2 2 6 9
13| 0 1 2 3 4 5 5 7 8 8 9
14| 2 6 8
15| 0 1 2 4 5 7 8 9
16| 1 5 7 9
How often did the company ship more 140 boats in a week? __________
(Short Answer)
4.8/5 (36)
The research director of a large oil company studied the buying habits of consumers with respect to the amount of gasoline purchased at full-service pumps. The arithmetic mean amount is 11.5 gallons and the median amount is 11.95 gallons. The standard deviation of the sample is 4.5 gallons. What is the Pearson's coefficient of skewness? ________
(Short Answer)
4.9/5 (33)
A telemarketing firm is monitoring the performance of its employees based on the number of sales per hour. One employee had the following sales for the last 20 hours. 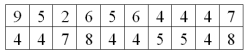 For the distribution of number of sales per hour, what is the interquartile range? __________.
(Short Answer)
4.9/5 (34)
The Pearson's coefficient of skewness (Sk) measures the amount of skewness and may range from -3.0 to +3.0. It is computed by subtracting the median from the mean, multiplying the result by 3 and dividing by _______________.
(Short Answer)
4.9/5 (30)
Filters
- Essay(0)
- Multiple Choice(0)
- Short Answer(0)
- True False(0)
- Matching(0)