Exam 4: Describing Data: Displaying and Exploring Data
Exam 1: What Is Statistics79 Questions
Exam 2: Describing Data: Frequency Tables, Frequency Distributions, and Graphic Presentation129 Questions
Exam 3: Describing Data: Numerical Measures132 Questions
Exam 4: Describing Data: Displaying and Exploring Data108 Questions
Exam 5: A Survey of Probability Concepts130 Questions
Exam 6: Discrete Probability Distributions128 Questions
Exam 7: Continuous Probability Distributions131 Questions
Exam 8: Sampling Methods and the Central Limit Theorem115 Questions
Exam 9: Estimation and Confidence Intervals129 Questions
Exam 10: One-Sample Tests of Hypothesis134 Questions
Exam 11: Two-Sample Tests of Hypothesis130 Questions
Exam 12: Analysis of Variance128 Questions
Exam 13: Correlation and Linear Regression130 Questions
Exam 14: Multiple Regression Analysis129 Questions
Exam 15: Index Numbers129 Questions
Exam 16: Time Series and Forecasting129 Questions
Exam 17: Nonparametric Methods: Goodness-Of-Fit Tests129 Questions
Exam 18: Nonparametric Methods: Analysis of Ranked Data129 Questions
Exam 19: Statistical Process Control and Quality Management129 Questions
Exam 20: An Introduction to Decision Theory115 Questions
Select questions type
The following stem and leaf display reports the number of boats shipped per week by Ottertail Boats, Inc.
11| 1 5 9
12| 0 1 2 2 6 9
13| 0 1 2 3 4 5 5 7 8 8 9
14| 2 6 8
15| 0 1 2 4 5 7 8 9
16| 1 5 7 9
List the actual values in the fourth class. ________________
(Short Answer)
4.9/5  (29)
(29)
A dot plot is an easy way to represent the relationship between two variables.
(True/False)
4.8/5 (33)
In the following set of data, what are the first, second, and third quartiles? 1 3 5 6 7 9 100
(Multiple Choice)
5.0/5 (33)
The following stem and leaf display reports the number of boats shipped per week by Ottertail Boats, Inc.
11| 1 5 9
12| 0 1 2 2 6 9
13| 0 1 2 3 4 5 5 7 8 8 9
14| 2 6 8
15| 0 1 2 4 5 7 8 9
16| 1 5 7 9
How many weeks were included in the study? _____________
(Short Answer)
4.7/5 (35)
The 50th percentile of a distribution is the same as the distribution mean.
(True/False)
4.8/5 (42)
The coefficient of skewness is the standard deviation divided by the mean.
(True/False)
4.8/5 (27)
Quartiles divide a frequency distribution into _______ equal parts.
(Short Answer)
4.9/5 (40)
What types of variables are summarized in a contingency table? ____________
(Short Answer)
4.7/5 (41)
A contingency table would be used to summarize data such as
(Multiple Choice)
4.8/5 (26)
A sample of the homes currently offered for sale revealed that the mean asking price is $75,900, the median $70,100 and the modal price is $67,200. The standard deviation of the distribution is $5,900. What is the Pearson's coefficient of skewness? __________
(Short Answer)
4.8/5 (30)
For the following data, find the information required to construct a box plot. 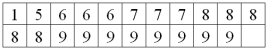
(Essay)
4.9/5 (34)
What is the best way to display the relationship between two variables measured on an interval or ratio level? _________
(Short Answer)
4.8/5 (41)
Given the sample information in the following table regarding public opinion on gun control, who is more likely to favor gun control? 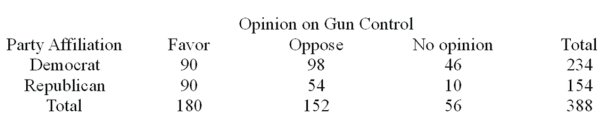
(Essay)
4.8/5 (26)
The following stem and leaf display reports the number of boats shipped per week by Ottertail Boats, Inc.
11| 1 5 9
12| 0 1 2 2 6 9
13| 0 1 2 3 4 5 5 7 8 8 9
14| 2 6 8
15| 0 1 2 4 5 7 8 9
16| 1 5 7 9
What are the smallest and largest values? ____________
(Short Answer)
5.0/5 (41)
The lengths of stay on the cancer floor of Community Hospital were organized into a frequency distribution. The mean length was 28 days, the median 25 days and the modal length 23 days. The standard deviation was computed to be 4.2 days. What is the Pearson's coefficient of skewness? __________
(Short Answer)
4.9/5 (26)
Filters
- Essay(0)
- Multiple Choice(0)
- Short Answer(0)
- True False(0)
- Matching(0)