Exam 4: Describing Data: Displaying and Exploring Data
Exam 1: What Is Statistics79 Questions
Exam 2: Describing Data: Frequency Tables, Frequency Distributions, and Graphic Presentation129 Questions
Exam 3: Describing Data: Numerical Measures132 Questions
Exam 4: Describing Data: Displaying and Exploring Data108 Questions
Exam 5: A Survey of Probability Concepts130 Questions
Exam 6: Discrete Probability Distributions128 Questions
Exam 7: Continuous Probability Distributions131 Questions
Exam 8: Sampling Methods and the Central Limit Theorem115 Questions
Exam 9: Estimation and Confidence Intervals129 Questions
Exam 10: One-Sample Tests of Hypothesis134 Questions
Exam 11: Two-Sample Tests of Hypothesis130 Questions
Exam 12: Analysis of Variance128 Questions
Exam 13: Correlation and Linear Regression130 Questions
Exam 14: Multiple Regression Analysis129 Questions
Exam 15: Index Numbers129 Questions
Exam 16: Time Series and Forecasting129 Questions
Exam 17: Nonparametric Methods: Goodness-Of-Fit Tests129 Questions
Exam 18: Nonparametric Methods: Analysis of Ranked Data129 Questions
Exam 19: Statistical Process Control and Quality Management129 Questions
Exam 20: An Introduction to Decision Theory115 Questions
Select questions type
A telemarketing firm is monitoring the performance of its employees based on the number of sales per hour. One employee had the following sales for the last 20 hours. 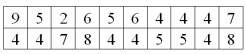 What is the third quartile for the distribution of number of sales per hour? _____________
(Short Answer)
4.7/5  (30)
(30)
In a negatively skewed distribution, the coefficient of skewness is _______________.
(Short Answer)
4.8/5 (34)
Percentiles divide a frequency distribution into _________ equal parts.
(Short Answer)
4.8/5 (33)
A stem-and-leaf display includes the following row: 5 | 10 11 31 52 79 98. Assume that the data is rounded to the nearest whole number.
(Multiple Choice)
4.7/5 (31)
A scatter diagram shows the ____________ between two interval or ratio variables.
(Short Answer)
4.8/5 (35)
A sample of experienced typists revealed that their mean typing speed is 87 words per minute and the median is 73. The standard deviation is 16.9 words per minute. What is the Pearson's coefficient of skewness?
(Multiple Choice)
4.9/5 (29)
In a contingency table, we describe the relationship between
(Multiple Choice)
4.7/5 (34)
What is the possible range of values for Pearson's coefficient of skewness?
(Multiple Choice)
4.9/5 (37)
What is the difference between a scatter diagram and a contingency table?
(Essay)
4.9/5 (30)
For the following data, find the information required to construct a box plot. 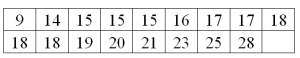
(Essay)
4.9/5 (37)
The following stem and leaf display reports the number of boats shipped per week by Ottertail Boats, Inc.
11| 1 5 9
12| 0 1 2 2 6 9
13| 0 1 2 3 4 5 5 7 8 8 9
14| 2 6 8
15| 0 1 2 4 5 7 8 9
16| 1 5 7 9
What is the median value? _______________
(Short Answer)
5.0/5 (37)
A scatter diagram of sales versus production may be constructed by plotting the minimum, first quartile, median, third quartile, and the maximum values of each variable.
(True/False)
4.9/5 (36)
What unit of measurement is used to express the coefficient of skewness? _________
(Short Answer)
4.9/5 (27)
Using the following statistics to describe a distribution of data, what is the interquartile range?
Minimum = 10
Q1 = 25
Median = 50
Q3 = 75
Maximum = 95
(Multiple Choice)
4.8/5 (37)
A telemarketing firm is monitoring the performance of its employees based on the number of sales per hour. One employee had the following sales for the last 20 hours. 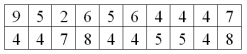 For the distribution of number of sales per hour, 50% are equal or greater than ___________.
(Short Answer)
4.7/5 (47)
Filters
- Essay(0)
- Multiple Choice(0)
- Short Answer(0)
- True False(0)
- Matching(0)