Exam 5: Price Controls and Market Efficiency
Exam 1: Economic Issues and Concepts130 Questions
Exam 2: Economic Theories,Data,and Graphs140 Questions
Exam 3: Demand, Supply, and Price161 Questions
Exam 4: Elasticity160 Questions
Exam 5: Price Controls and Market Efficiency125 Questions
Exam 6: Consumer Behaviour140 Questions
Exam 7: Producers in the Short Run144 Questions
Exam 8: Producers in the Long Run141 Questions
Exam 9: Competitive Markets154 Questions
Exam 10: Monopoly, cartels, and Price Discrimination126 Questions
Exam 11: Imperfect Competition and Strategic Behaviour126 Questions
Exam 12: Economic Efficiency and Public Policy123 Questions
Exam 13: How Factor Markets Work123 Questions
Exam 14: Labour Markets and Income Inequality119 Questions
Exam 15: Interest Rates and the Capital Market107 Questions
Exam 16: Market Failures and Government Intervention123 Questions
Exam 17: The Economics of Environmental Protection133 Questions
Exam 18: Taxation and Public Expenditure121 Questions
Exam 19: What Macroeconomics Is All About116 Questions
Exam 20: The Measurement of National Income117 Questions
Exam 21: The Simplest Short-Run Macro Model156 Questions
Exam 22: Adding Government and Trade to the Simple Macro Model132 Questions
Exam 23: Output and Prices in the Short Run142 Questions
Exam 24: From the Short Run to the Long Run: The Adjustment of Factor Prices149 Questions
Exam 25: Long-Run Economic Growth129 Questions
Exam 26: Money and Banking129 Questions
Exam 27: Money, Interest Rates, and Economic Activity135 Questions
Exam 28: Monetary Policy in Canada119 Questions
Exam 29: Inflation and Disinflation122 Questions
Exam 30: Unemployment Fluctuations and the Nairu120 Questions
Exam 31: Government Debt and Deficits129 Questions
Exam 32: The Gains From International Trade127 Questions
Exam 33: Trade Policy126 Questions
Exam 34: Exchange Rates and the Balance of Payments161 Questions
Select questions type
Which of the following is true of price ceilings?
Free
(Multiple Choice)
4.8/5  (25)
(25)
Correct Answer: Verified
B
Assume that the long-run supply of housing is highly elastic.The imposition of binding rent controls will lead to
Free
(Multiple Choice)
4.7/5 (28)
Correct Answer:Verified
B
Each point on a supply curve shows the ________ acceptable price to firms for selling that unit; this price reflects ________ to firms from producing that unit.
Free
(Multiple Choice)
4.9/5 (38)
Correct Answer:Verified
E
Consider the Canadian market for barley.Suppose a marketing board sets a production quota which is below the equilibrium quantity.The quota will cause the price of barley to ________ and the total revenue earned by Canadian barley farmers to ________.
(Multiple Choice)
4.7/5 (36)
Demand and Supply Schedules for Chocolate Bars
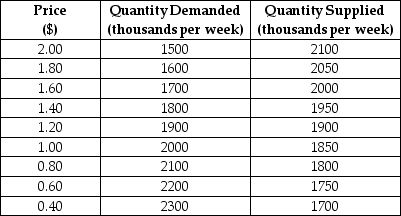 TABLE 5-1
-Refer to Table 5-1.Suppose the government imposed a price of $1.80 per chocolate bar.A likely result from this policy is
TABLE 5-1
-Refer to Table 5-1.Suppose the government imposed a price of $1.80 per chocolate bar.A likely result from this policy is
(Multiple Choice)
4.9/5 (39)
At any disequilibrium price,whether government controlled or not,the quantity actually exchanged is determined by
(Multiple Choice)
4.8/5 (33)
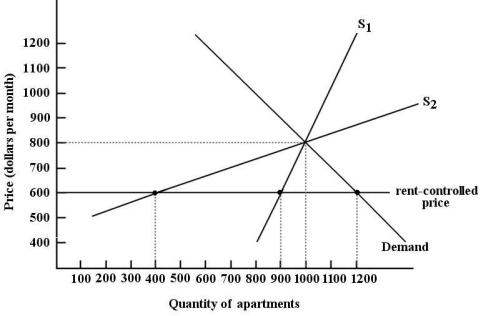 FIGURE 5-4
-Refer to Figure 5-4.The difference between supply curve S1 and supply curve S2 in this market for apartments is that
FIGURE 5-4
-Refer to Figure 5-4.The difference between supply curve S1 and supply curve S2 in this market for apartments is that
(Multiple Choice)
4.9/5 (26)
Suppose the government establishes a ceiling on the price of rental accommodation that is lower than the free-market equilibrium price.In this case,
(Multiple Choice)
4.7/5 (38)
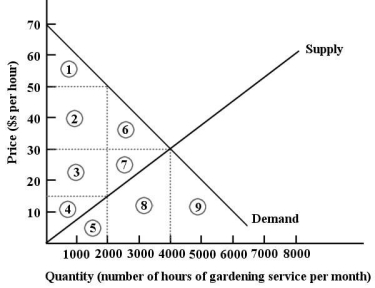 FIGURE 5-5
-Refer to Figure 5-5.At the market-clearing price and quantity of $30 per hour and 4000 hours of gardening services,we can say that
FIGURE 5-5
-Refer to Figure 5-5.At the market-clearing price and quantity of $30 per hour and 4000 hours of gardening services,we can say that
(Multiple Choice)
4.9/5 (32)
If the equilibrium price for some product is $1000,a price ceiling of $1200 will result in
(Multiple Choice)
4.8/5 (37)
In competitive markets,binding price floors and binding price ceilings lead to
(Multiple Choice)
4.9/5 (37)
The shortages associated with a binding price ceiling will be the smallest when
(Multiple Choice)
4.8/5 (28)
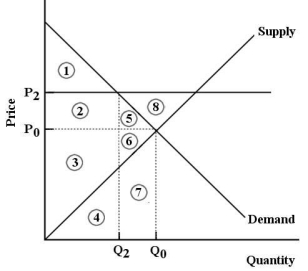 FIGURE 5-7
-Refer to Figure 5-7.The market for good X is in equilibrium at P0 and Q0.Now suppose the government imposes a ________ at P2.One result would be ________.
FIGURE 5-7
-Refer to Figure 5-7.The market for good X is in equilibrium at P0 and Q0.Now suppose the government imposes a ________ at P2.One result would be ________.
(Multiple Choice)
4.8/5 (33)
Consider a competitive labour market.The likely consequence of a binding minimum wage in this labour market is
(Multiple Choice)
4.8/5 (30)
Suppose the government sets a particular price in the market for gold,which results in an excess supply.In this situation,
(Multiple Choice)
4.9/5 (41)
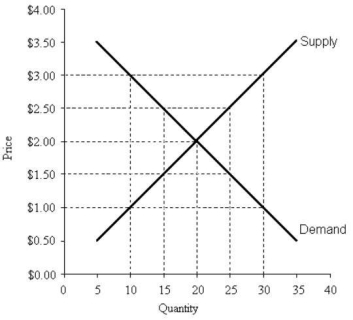 FIGURE 5-2
-Refer to Figure 5-2.A price floor set at $2.50 will result in
FIGURE 5-2
-Refer to Figure 5-2.A price floor set at $2.50 will result in
(Multiple Choice)
4.8/5 (30)
If the free-market equilibrium price for some product is $25,then a legal price ceiling set at $15 will bring about
(Multiple Choice)
4.9/5 (35)
FIGURE 5-5
-Refer to Figure 5-5.Suppose this market for gardening services is in a free-market equilibrium.If the government then imposes a price floor of $50 per hour for gardening services,the result would be
(Multiple Choice)
4.9/5 (35)
If the government fixes the price of good X above its free-market equilibrium level,we should expect
(Multiple Choice)
5.0/5 (28)
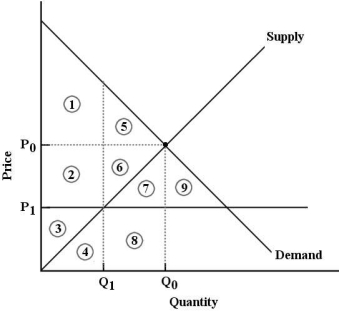 FIGURE 5-6
-Refer to Figure 5-6.The market for good X is in equilibrium at P0 and Q0.Economic surplus is represented by
FIGURE 5-6
-Refer to Figure 5-6.The market for good X is in equilibrium at P0 and Q0.Economic surplus is represented by
(Multiple Choice)
4.9/5 (40)
Filters
- Essay(0)
- Multiple Choice(0)
- Short Answer(0)
- True False(0)
- Matching(0)