Exam 12: Economic Efficiency and Public Policy
Exam 1: Economic Issues and Concepts130 Questions
Exam 2: Economic Theories,Data,and Graphs140 Questions
Exam 3: Demand, Supply, and Price161 Questions
Exam 4: Elasticity160 Questions
Exam 5: Price Controls and Market Efficiency125 Questions
Exam 6: Consumer Behaviour140 Questions
Exam 7: Producers in the Short Run144 Questions
Exam 8: Producers in the Long Run141 Questions
Exam 9: Competitive Markets154 Questions
Exam 10: Monopoly, cartels, and Price Discrimination126 Questions
Exam 11: Imperfect Competition and Strategic Behaviour126 Questions
Exam 12: Economic Efficiency and Public Policy123 Questions
Exam 13: How Factor Markets Work123 Questions
Exam 14: Labour Markets and Income Inequality119 Questions
Exam 15: Interest Rates and the Capital Market107 Questions
Exam 16: Market Failures and Government Intervention123 Questions
Exam 17: The Economics of Environmental Protection133 Questions
Exam 18: Taxation and Public Expenditure121 Questions
Exam 19: What Macroeconomics Is All About116 Questions
Exam 20: The Measurement of National Income117 Questions
Exam 21: The Simplest Short-Run Macro Model156 Questions
Exam 22: Adding Government and Trade to the Simple Macro Model132 Questions
Exam 23: Output and Prices in the Short Run142 Questions
Exam 24: From the Short Run to the Long Run: The Adjustment of Factor Prices149 Questions
Exam 25: Long-Run Economic Growth129 Questions
Exam 26: Money and Banking129 Questions
Exam 27: Money, Interest Rates, and Economic Activity135 Questions
Exam 28: Monetary Policy in Canada119 Questions
Exam 29: Inflation and Disinflation122 Questions
Exam 30: Unemployment Fluctuations and the Nairu120 Questions
Exam 31: Government Debt and Deficits129 Questions
Exam 32: The Gains From International Trade127 Questions
Exam 33: Trade Policy126 Questions
Exam 34: Exchange Rates and the Balance of Payments161 Questions
Select questions type
Suppose your municipality charges your household a flat fee of $100 per year plus $2 per cubic metre of water used.This pricing policy is an example of
Free
(Multiple Choice)
4.8/5  (38)
(38)
Correct Answer: Verified
C
The diagram below shows cost and revenue curves for a natural monopoly producing electricity.Price is dollars per kilowatt hour and quantity is kilowatt hours per day. 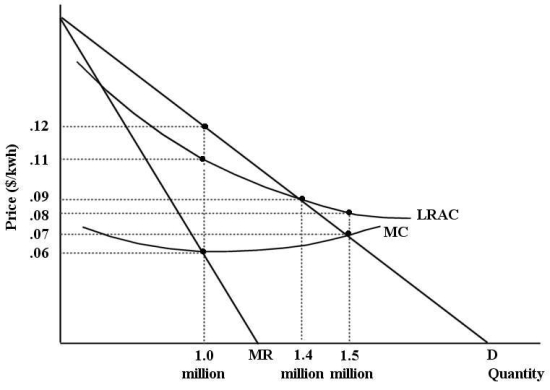 FIGURE 12-7
-Refer to Figure 12-7.If this firm were unregulated and profit maximizing,its price and output would be ________ per kwh and ________ kwh per day.
FIGURE 12-7
-Refer to Figure 12-7.If this firm were unregulated and profit maximizing,its price and output would be ________ per kwh and ________ kwh per day.
Free
(Multiple Choice)
4.7/5 (37)
Correct Answer:Verified
C
An important defence of oligopoly as a market structure is that
Free
(Multiple Choice)
4.8/5 (34)
Correct Answer:Verified
C
Consider three firms,A,B and C,all producing kilos of potatoes (per year)in a perfectly competitive market.The diagrams below show marginal cost curves for each of the three firms. 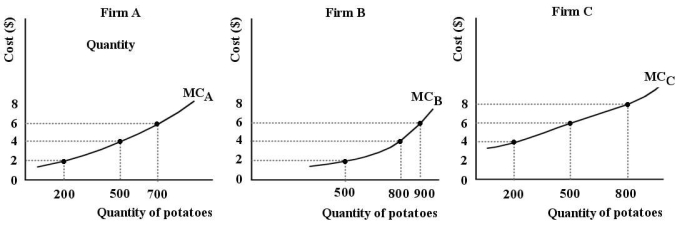 FIGURE 12-1
-Refer to Figure 12-1.Suppose each of Firms A,B,and C are producing 500 kilos of potatoes.Is this industry productively efficient?
FIGURE 12-1
-Refer to Figure 12-1.Suppose each of Firms A,B,and C are producing 500 kilos of potatoes.Is this industry productively efficient?
(Multiple Choice)
4.9/5 (47)
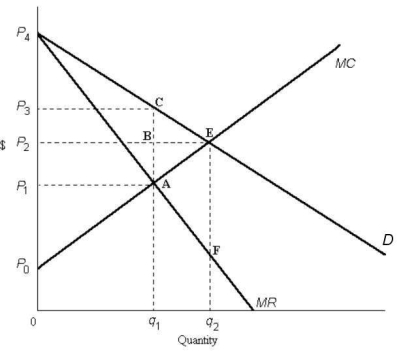 FIGURE 12-3
-Refer to Figure 12-3.The area representing consumer surplus in a perfectly competitive equilibrium is outlined by
FIGURE 12-3
-Refer to Figure 12-3.The area representing consumer surplus in a perfectly competitive equilibrium is outlined by
(Multiple Choice)
4.9/5 (37)
Canadian governments (federal,provincial and municipal)employ public ownership or regulation of industries in an effort to
(Multiple Choice)
5.0/5 (40)
In many cases throughout Canadian history,governments have sought to control the behaviour of oligopolistic firms through either ownership or regulation.Policymakers are now skeptical of such practices because
1)many innovations in products and production methods that have led to increases in living standards are attributable to firms in oligopolistic industries;
2)it became clear that oligopolistic industries can achieve both productive and allocative efficiency without government intervention;
3)the regulatory body often ends up protecting the firms from competition.
(Multiple Choice)
4.7/5 (35)
FIGURE 12-3
-Refer to Figure 12-3.Comparing the monopoly equilibrium to the perfectly competitive equilibrium,the area representing the gain in producer surplus due to monopoly is outlined by
(Multiple Choice)
4.9/5 (28)
The production possibilities boundary shows possible combinations of guns and butter that can be produced by a country.The lower diagram shows demand and supply for butter. 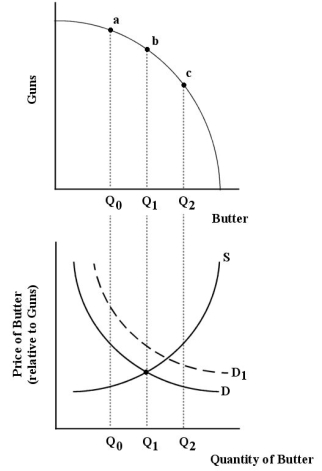 FIGURE 12-2
-Refer to Figure 12-2.Suppose demand and supply for butter are shown by D and S,respectively.And suppose the economy is at point (a)on the production possibilities boundary.How can this economy move toward allocative efficiency?
FIGURE 12-2
-Refer to Figure 12-2.Suppose demand and supply for butter are shown by D and S,respectively.And suppose the economy is at point (a)on the production possibilities boundary.How can this economy move toward allocative efficiency?
(Multiple Choice)
4.9/5 (31)
The diagram below shows supply,demand,and quantity exchanged of Monday matinee movie tickets.Assume it is a perfectly competitive market. 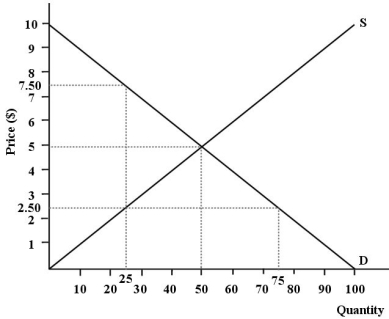 FIGURE 12-4
-Refer to Figure 12-4.What is the total revenue received by the sellers of this product at the allocatively efficient level of output?
FIGURE 12-4
-Refer to Figure 12-4.What is the total revenue received by the sellers of this product at the allocatively efficient level of output?
(Multiple Choice)
4.9/5 (38)
The diagram below shows the market demand curve and the cost curves for a single firm. 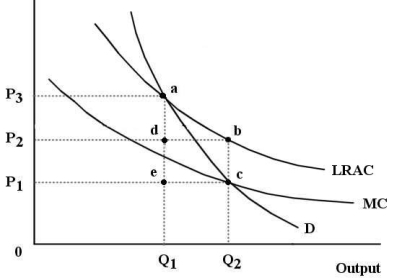 FIGURE 12-6
-Refer to Figure 12-6.Suppose this firm is being regulated using a policy of average-cost pricing.In this case,economic profits to the firm are represented by the area
FIGURE 12-6
-Refer to Figure 12-6.Suppose this firm is being regulated using a policy of average-cost pricing.In this case,economic profits to the firm are represented by the area
(Multiple Choice)
4.8/5 (49)
The diagram below shows supply,demand,and quantity exchanged of Monday matinee movie tickets.Assume it is a perfectly competitive market. FIGURE 12-4
-Refer to Figure 12-4.If a disequilibrium price of $7.50 per movie ticket were imposed on this market,this market would not be allocatively efficient because 1)the sum of consumer and producer surplus would not be maximized;
2)the marginal benefit to consumers of the last movie consumed would be greater than the marginal cost to the seller;
3)the marginal cost to the seller of the last movie consumed would be more than the marginal benefit to consumers.
(Multiple Choice)
4.9/5 (43)
In Canada,the Competition Act specifies that in antitrust cases the "watchdog" is the
(Multiple Choice)
4.9/5 (29)
In Canada,alleged violations of the Competition Act are referred to the ________ for adjudication.
(Multiple Choice)
4.9/5 (36)
The diagram below shows the demand and supply curves in a perfectly competitive market. 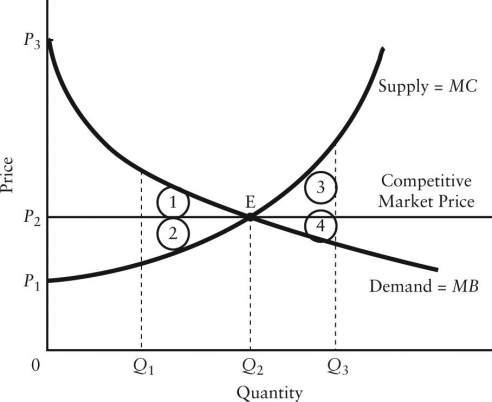 FIGURE 12-5
-Refer to Figure 12-5.In the free-market equilibrium,producer plus consumer surplus is maximized and is illustrated by the area
FIGURE 12-5
-Refer to Figure 12-5.In the free-market equilibrium,producer plus consumer surplus is maximized and is illustrated by the area
(Multiple Choice)
4.8/5 (40)
In which of the following situations would a natural monopoly exist?
(Multiple Choice)
4.7/5 (32)
The diagram below shows the market demand curve and the cost curves for a single firm. FIGURE 12-6
-Refer to Figure 12-6.Suppose this firm is being regulated using a policy of marginal-cost pricing.To maintain the resulting level of output
(Multiple Choice)
4.7/5 (27)
Filters
- Essay(0)
- Multiple Choice(0)
- Short Answer(0)
- True False(0)
- Matching(0)