Exam 6: Consumer Behaviour
Exam 1: Economic Issues and Concepts130 Questions
Exam 2: Economic Theories,Data,and Graphs140 Questions
Exam 3: Demand, Supply, and Price161 Questions
Exam 4: Elasticity160 Questions
Exam 5: Price Controls and Market Efficiency125 Questions
Exam 6: Consumer Behaviour140 Questions
Exam 7: Producers in the Short Run144 Questions
Exam 8: Producers in the Long Run141 Questions
Exam 9: Competitive Markets154 Questions
Exam 10: Monopoly, cartels, and Price Discrimination126 Questions
Exam 11: Imperfect Competition and Strategic Behaviour126 Questions
Exam 12: Economic Efficiency and Public Policy123 Questions
Exam 13: How Factor Markets Work123 Questions
Exam 14: Labour Markets and Income Inequality119 Questions
Exam 15: Interest Rates and the Capital Market107 Questions
Exam 16: Market Failures and Government Intervention123 Questions
Exam 17: The Economics of Environmental Protection133 Questions
Exam 18: Taxation and Public Expenditure121 Questions
Exam 19: What Macroeconomics Is All About116 Questions
Exam 20: The Measurement of National Income117 Questions
Exam 21: The Simplest Short-Run Macro Model156 Questions
Exam 22: Adding Government and Trade to the Simple Macro Model132 Questions
Exam 23: Output and Prices in the Short Run142 Questions
Exam 24: From the Short Run to the Long Run: The Adjustment of Factor Prices149 Questions
Exam 25: Long-Run Economic Growth129 Questions
Exam 26: Money and Banking129 Questions
Exam 27: Money, Interest Rates, and Economic Activity135 Questions
Exam 28: Monetary Policy in Canada119 Questions
Exam 29: Inflation and Disinflation122 Questions
Exam 30: Unemployment Fluctuations and the Nairu120 Questions
Exam 31: Government Debt and Deficits129 Questions
Exam 32: The Gains From International Trade127 Questions
Exam 33: Trade Policy126 Questions
Exam 34: Exchange Rates and the Balance of Payments161 Questions
Select questions type
The figures below show Chris's consumption of specialty coffee per week. 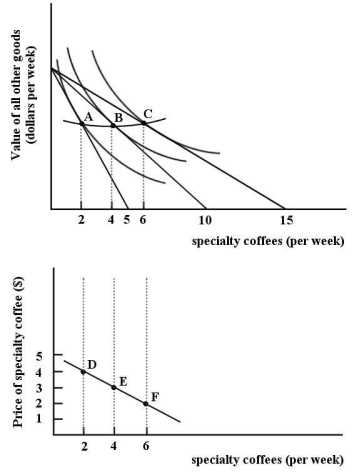 FIGURE 6-10
-Refer to Figure 6-10.The line connecting points A,B and C is ________.The line connecting points D,E and F is ________.
FIGURE 6-10
-Refer to Figure 6-10.The line connecting points A,B and C is ________.The line connecting points D,E and F is ________.
Free
(Multiple Choice)
4.8/5  (30)
(30)
Correct Answer: Verified
A
The table below shows the quantities of toffee bars and bags of cashews that a consumer could consume over a 1-week period.
Toffee (bars) Cashews (bags)
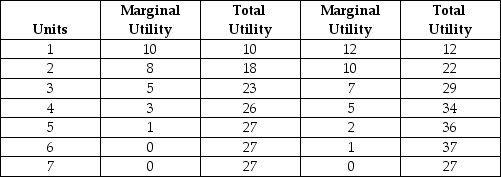 TABLE 6-1
-Refer to Table 6-1.The maximum utility that a consumer can obtain from toffee bars and bags of cashews per week is
TABLE 6-1
-Refer to Table 6-1.The maximum utility that a consumer can obtain from toffee bars and bags of cashews per week is
Free
(Multiple Choice)
4.7/5 (35)
Correct Answer:Verified
D
The diagram below shows a set of budget lines facing a household. 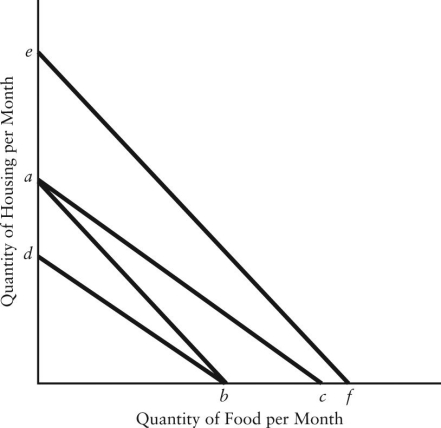 FIGURE 6-8
-Refer to Figure 6-8.The movement of the budget line from ab to db could be caused by
FIGURE 6-8
-Refer to Figure 6-8.The movement of the budget line from ab to db could be caused by
Free
(Multiple Choice)
4.9/5 (36)
Correct Answer:Verified
B
Diagrams A,B,and C show 3 individual consumers' demand curves for cement.Consumers A,B,and C constitute the entire monthly cement market in this region. 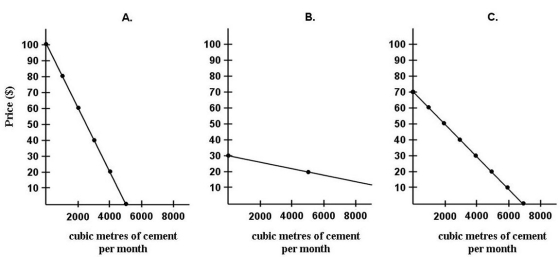 FIGURE 6-3
-Refer to Figure 6-3.What is the market demand (in cubic metres per month)for cement at a price of $80 per cubic metre?
FIGURE 6-3
-Refer to Figure 6-3.What is the market demand (in cubic metres per month)for cement at a price of $80 per cubic metre?
(Multiple Choice)
4.8/5 (31)
The table below shows the total value (in dollars)that Andrew gets from playing 9-hole rounds of golf.
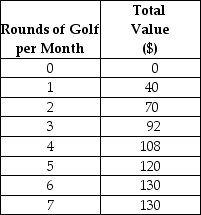 TABLE 6-3
-Refer to Table 6-3.If the price of a 9-hole round of golf is $16,and Andrew is maximizing his utility,then his consumer surplus will be
TABLE 6-3
-Refer to Table 6-3.If the price of a 9-hole round of golf is $16,and Andrew is maximizing his utility,then his consumer surplus will be
(Multiple Choice)
4.9/5 (35)
Consider the income and substitution effects of price changes.If the price of a normal good changes,the income effect of the price change will
(Multiple Choice)
4.8/5 (39)
Consider the income and substitution effects of price changes.For a product with an income elasticity greater than one,a price increase will cause the consumer's real income to
(Multiple Choice)
4.8/5 (32)
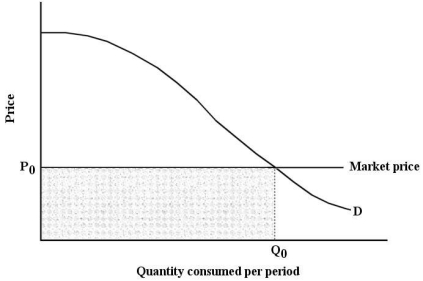 FIGURE 6-7
-Refer to Figure 6-7.Suppose that price is P0.The market value of the quantity purchased is given by the area
FIGURE 6-7
-Refer to Figure 6-7.Suppose that price is P0.The market value of the quantity purchased is given by the area
(Multiple Choice)
4.8/5 (36)
Assume the quantity of good X is measured on the horizontal axis and the quantity of good Y on the vertical axis.Initial prices are PX = $5 and PY = $10.The consumer's income is $100.If PY increases to $20,then
(Multiple Choice)
4.7/5 (30)
Suppose the price of potatoes falls and we observe a decrease in an individual's purchases of potatoes.Which of the following can we infer?
(Multiple Choice)
4.8/5 (34)
Consider the income and substitution effects of price changes.The income effect refers to the change in quantity demanded that occurs as a result of a change in
(Multiple Choice)
4.9/5 (24)
If total utility from the consumption of some product is increasing as more units are consumed,then marginal utility must be
(Multiple Choice)
4.7/5 (41)
FIGURE 6-7
-Refer to Figure 6-7.Suppose that price is P0.Total consumer surplus is then given by the area
(Multiple Choice)
5.0/5 (42)
In indifference curve analysis,the consumer's utility-maximizing point is where
(Multiple Choice)
4.7/5 (45)
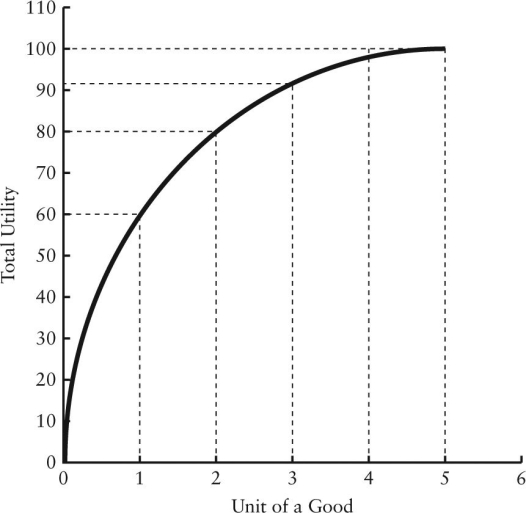 FIGURE 6-1
-Refer to Figure 6-1.This figure illustrates the law of
FIGURE 6-1
-Refer to Figure 6-1.This figure illustrates the law of
(Multiple Choice)
4.7/5 (30)
The table below shows the quantities of toffee bars and bags of cashews that a consumer could consume over a 1-week period.
Toffee (bars) Cashews (bags)
TABLE 6-1
-Refer to Table 6-1.If the price of toffee bars is $1 each,bags of cashews are $2 each,and this consumer has $7 per week to spend on these two snacks,how many of each will he/she purchase to maximize utility?
(Multiple Choice)
4.9/5 (35)
Filters
- Essay(0)
- Multiple Choice(0)
- Short Answer(0)
- True False(0)
- Matching(0)