Exam 2: Economic Theories,Data,and Graphs
Exam 1: Economic Issues and Concepts130 Questions
Exam 2: Economic Theories,Data,and Graphs140 Questions
Exam 3: Demand, Supply, and Price161 Questions
Exam 4: Elasticity160 Questions
Exam 5: Price Controls and Market Efficiency125 Questions
Exam 6: Consumer Behaviour140 Questions
Exam 7: Producers in the Short Run144 Questions
Exam 8: Producers in the Long Run141 Questions
Exam 9: Competitive Markets154 Questions
Exam 10: Monopoly, cartels, and Price Discrimination126 Questions
Exam 11: Imperfect Competition and Strategic Behaviour126 Questions
Exam 12: Economic Efficiency and Public Policy123 Questions
Exam 13: How Factor Markets Work123 Questions
Exam 14: Labour Markets and Income Inequality119 Questions
Exam 15: Interest Rates and the Capital Market107 Questions
Exam 16: Market Failures and Government Intervention123 Questions
Exam 17: The Economics of Environmental Protection133 Questions
Exam 18: Taxation and Public Expenditure121 Questions
Exam 19: What Macroeconomics Is All About116 Questions
Exam 20: The Measurement of National Income117 Questions
Exam 21: The Simplest Short-Run Macro Model156 Questions
Exam 22: Adding Government and Trade to the Simple Macro Model132 Questions
Exam 23: Output and Prices in the Short Run142 Questions
Exam 24: From the Short Run to the Long Run: The Adjustment of Factor Prices149 Questions
Exam 25: Long-Run Economic Growth129 Questions
Exam 26: Money and Banking129 Questions
Exam 27: Money, Interest Rates, and Economic Activity135 Questions
Exam 28: Monetary Policy in Canada119 Questions
Exam 29: Inflation and Disinflation122 Questions
Exam 30: Unemployment Fluctuations and the Nairu120 Questions
Exam 31: Government Debt and Deficits129 Questions
Exam 32: The Gains From International Trade127 Questions
Exam 33: Trade Policy126 Questions
Exam 34: Exchange Rates and the Balance of Payments161 Questions
Select questions type
The table below shows the approximate value of Canada's crude oil and natural gas exports over a 5-year period.The amounts shown are billions of dollars.
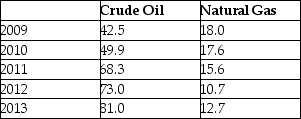 TABLE 2-7
-Refer to Table 2-7.Assume that 2009 is the base year,with an index number = 100.What is the percentage change in the value of exports of crude oil from 2012 to 2013?
TABLE 2-7
-Refer to Table 2-7.Assume that 2009 is the base year,with an index number = 100.What is the percentage change in the value of exports of crude oil from 2012 to 2013?
Free
(Multiple Choice)
4.9/5  (36)
(36)
Correct Answer: Verified
B
The table below shows hypothetical data for the volume of gold and nickel output across several years.
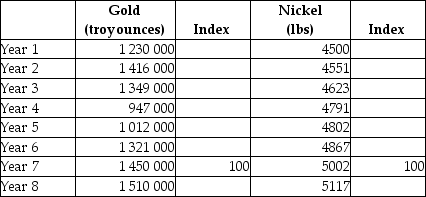 TABLE 2-6
-Refer to Table 2-6.What is the percentage change in gold output from Year 1 to Year 7?
TABLE 2-6
-Refer to Table 2-6.What is the percentage change in gold output from Year 1 to Year 7?
Free
(Multiple Choice)
4.8/5 (34)
Correct Answer:Verified
A
The table below shows hypothetical tuition costs at a Canadian university.
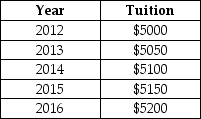 TABLE 2-1
-Refer to Table 2-1.Assume that 2014 is used as the base year,with the index number = 100.The value of the index number in 2012 is calculated as follows:
TABLE 2-1
-Refer to Table 2-1.Assume that 2014 is used as the base year,with the index number = 100.The value of the index number in 2012 is calculated as follows:
Free
(Multiple Choice)
4.9/5 (44)
Correct Answer:Verified
E
Choose the statement that best characterizes an economic theory.A valid theory
(Multiple Choice)
4.9/5 (41)
The table below shows hypothetical per-minute cell phone charges for "pay-and-talk" service over several years.
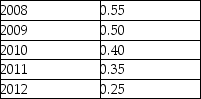 TABLE 2-2
-Refer to Table 2-2.Assume that 2008 is used as the base year,with the index number = 100.What is the percentage change in the per-minute charge from 2011 to 2012?
TABLE 2-2
-Refer to Table 2-2.Assume that 2008 is used as the base year,with the index number = 100.What is the percentage change in the per-minute charge from 2011 to 2012?
(Multiple Choice)
4.8/5 (41)
The table below shows the approximate value of Canada's crude oil and natural gas exports over a 5-year period.The amounts shown are billions of dollars.
TABLE 2-7
-Refer to Table 2-7.Assume that 2009 is the base year,with an index number = 100.What is the percentage change in the value of exports of natural gas from 2012 to 2013?
(Multiple Choice)
4.7/5 (27)
On a coordinate graph with y on the vertical axis and x on the horizontal axis,what is the Y intercept of the function X = 60 + 3Y?
(Multiple Choice)
4.9/5 (30)
Which is the best description of positive statements? Positive statements
(Multiple Choice)
4.9/5 (41)
Figure 2-5 shows monthly average (per unit)production costs for producing Good X. 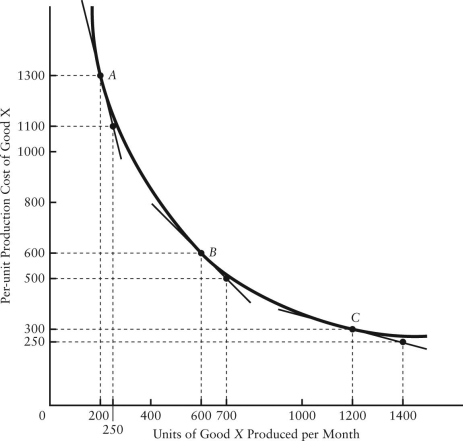 FIGURE 2-5
-Refer to Figure 2-5.What is the slope of this non-linear function when 1200 units per month are being produced?
FIGURE 2-5
-Refer to Figure 2-5.What is the slope of this non-linear function when 1200 units per month are being produced?
(Multiple Choice)
4.8/5 (28)
The table below shows hypothetical prices for a particular anatomy textbook at a university bookstore over several years.
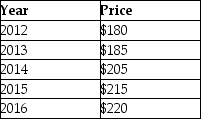 TABLE 2-4
-Refer to Table 2-4.The increase in the price of the textbook from 2012 to 2016 is
TABLE 2-4
-Refer to Table 2-4.The increase in the price of the textbook from 2012 to 2016 is
(Multiple Choice)
4.9/5 (33)
An economist has data showing household income and energy consumption for 10 000 Canadian households.The best way to illustrate these data is
(Multiple Choice)
4.8/5 (38)
Which of the following statements belongs more properly in the field of normative economics than positive economics?
(Multiple Choice)
4.9/5 (33)
When an increase in one variable is associated with an increase in a second variable,the two variables are
(Multiple Choice)
4.7/5 (36)
The table below shows hypothetical data for the volume of gold and nickel output across several years.
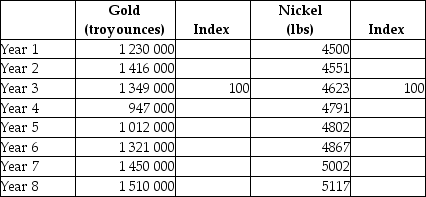 TABLE 2-5
-Refer to Table 2-5.What is the index number for nickel output in Year 2?
TABLE 2-5
-Refer to Table 2-5.What is the index number for nickel output in Year 2?
(Multiple Choice)
4.8/5 (41)
The table below shows hypothetical data for the volume of gold and nickel output across several years.
TABLE 2-5
-Refer to Table 2-5.What is the index number for nickel output in Year 6?
(Multiple Choice)
4.8/5 (35)
The table below shows hypothetical prices for a particular anatomy textbook at a university bookstore over several years.
TABLE 2-4
-Refer to Table 2-4.Assume that 2016 is used as the base year,with the index number = 100.The value of the index number in 2012 is
(Multiple Choice)
4.9/5 (34)
When an economist assumes that the owners of firms are motivated only by the desire to maximize profits,the economist most likely believes that
(Multiple Choice)
4.7/5 (33)
The statement that a country's rate of economic growth is influenced by its firms' investment behaviour is an example of a(n)
(Multiple Choice)
4.8/5 (44)
Filters
- Essay(0)
- Multiple Choice(0)
- Short Answer(0)
- True False(0)
- Matching(0)