Exam 31: Government Debt and Deficits
Exam 1: Economic Issues and Concepts130 Questions
Exam 2: Economic Theories,Data,and Graphs140 Questions
Exam 3: Demand, Supply, and Price161 Questions
Exam 4: Elasticity160 Questions
Exam 5: Price Controls and Market Efficiency125 Questions
Exam 6: Consumer Behaviour140 Questions
Exam 7: Producers in the Short Run144 Questions
Exam 8: Producers in the Long Run141 Questions
Exam 9: Competitive Markets154 Questions
Exam 10: Monopoly, cartels, and Price Discrimination126 Questions
Exam 11: Imperfect Competition and Strategic Behaviour126 Questions
Exam 12: Economic Efficiency and Public Policy123 Questions
Exam 13: How Factor Markets Work123 Questions
Exam 14: Labour Markets and Income Inequality119 Questions
Exam 15: Interest Rates and the Capital Market107 Questions
Exam 16: Market Failures and Government Intervention123 Questions
Exam 17: The Economics of Environmental Protection133 Questions
Exam 18: Taxation and Public Expenditure121 Questions
Exam 19: What Macroeconomics Is All About116 Questions
Exam 20: The Measurement of National Income117 Questions
Exam 21: The Simplest Short-Run Macro Model156 Questions
Exam 22: Adding Government and Trade to the Simple Macro Model132 Questions
Exam 23: Output and Prices in the Short Run142 Questions
Exam 24: From the Short Run to the Long Run: The Adjustment of Factor Prices149 Questions
Exam 25: Long-Run Economic Growth129 Questions
Exam 26: Money and Banking129 Questions
Exam 27: Money, Interest Rates, and Economic Activity135 Questions
Exam 28: Monetary Policy in Canada119 Questions
Exam 29: Inflation and Disinflation122 Questions
Exam 30: Unemployment Fluctuations and the Nairu120 Questions
Exam 31: Government Debt and Deficits129 Questions
Exam 32: The Gains From International Trade127 Questions
Exam 33: Trade Policy126 Questions
Exam 34: Exchange Rates and the Balance of Payments161 Questions
Select questions type
The diagram below is for a closed economy which begins in long-run equilibrium at Y* and  .
. 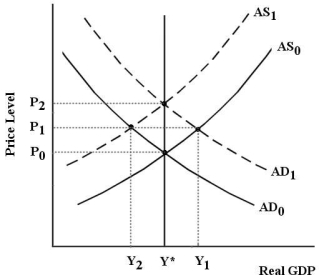 FIGURE 31-3
-Refer to Figure 31-3.Suppose the government in this closed economy implements an expansionary fiscal policy,which increases the budget deficit.When the economy reaches its new long-run equilibrium,how has the composition of national income changed?
FIGURE 31-3
-Refer to Figure 31-3.Suppose the government in this closed economy implements an expansionary fiscal policy,which increases the budget deficit.When the economy reaches its new long-run equilibrium,how has the composition of national income changed?
Free
(Multiple Choice)
4.8/5  (41)
(41)
Correct Answer: Verified
B
Suppose the real interest rate on government bonds is 5% while the growth rate of real GDP is 4%,and that the government's current debt-to-GDP ratio is 30%.If the government has a primary budget balance of zero in the current year,the debt-to-GDP ratio will
Free
(Multiple Choice)
4.9/5 (35)
Correct Answer:Verified
B
The budget deficit function is graphed with the budget deficit on the vertical axis and ________ on the horizontal axis,and is ________.
Free
(Multiple Choice)
4.9/5 (32)
Correct Answer:Verified
A
Until the onset of the most recent recession in 2009,Canadian governments (federal and provincial)had been running budget surpluses for about 10 years.Economic theory suggests that,other things being equal,these budget surpluses will lead to
(Multiple Choice)
4.8/5 (28)
The table below shows government purchases (G),net tax revenues (T),and debt-service payments (iD)over a 4-year period for a hypothetical economy.All figures are in billions of dollars.Assume the stock of debt at the end of 2012 is $500 billion.
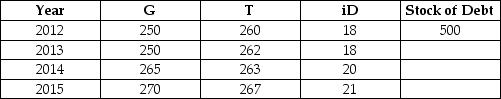 TABLE 31-1
-Refer to Table 31.1.What is the stock of debt at the end of 2013?
TABLE 31-1
-Refer to Table 31.1.What is the stock of debt at the end of 2013?
(Multiple Choice)
4.7/5 (33)
The stock of government debt will continue to rise unless the government
(Multiple Choice)
4.9/5 (34)
Suppose the government decided to ensure that its structural budget deficit was always zero.This policy would be problematic because
(Multiple Choice)
4.9/5 (38)
In general,the government will have ________ flexibility in implementing counter-cyclical fiscal policy when the outstanding stock of government debt is ________ relative to the size of GDP.
(Multiple Choice)
4.7/5 (40)
Consider a closed-economy AD/AS macro model.A policy-induced increase in the government's budget deficit is most likely to crowd-out private investment if
(Multiple Choice)
4.9/5 (41)
The diagram below shows two budget deficit functions for a hypothetical economy. 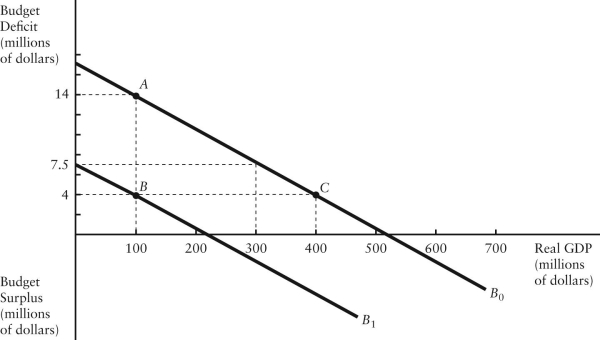 FIGURE 31-2
-Refer to Figure 31-2.Initially,suppose the economy is at point A on budget deficit function
FIGURE 31-2
-Refer to Figure 31-2.Initially,suppose the economy is at point A on budget deficit function  .Real GDP (Y)is $100 million.If the level of potential output (Y*)were $300 million,how much of the actual budget deficit is due to the underlying structure of fiscal policy and is therefore independent of the current level of GDP?
(Multiple Choice)
4.7/5 (26)
Consider the government's budget deficit function.Other things being equal,an autonomous increase in government purchases causes ________ the budget deficit function.
(Multiple Choice)
4.8/5 (32)
The data below provides the Actual and Structural Budget Deficits,as a percentage of real GDP,for Canada between 1999 and 2010.Note that a negative value in the table indicates a budget surplus.
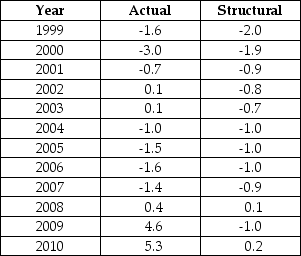 TABLE 31-2
-Refer to Table 31-2.Based on the data in the table,over which of the following intervals was fiscal policy expansionary?
TABLE 31-2
-Refer to Table 31-2.Based on the data in the table,over which of the following intervals was fiscal policy expansionary?
(Multiple Choice)
4.7/5 (30)
Suppose the government's debt-to-GDP ratio on January 1 of Year 1 is 32%.The change in the debt-to-GDP ratio during Year 1 is -0.037.On January 1 of Year 2 the government's debt-to-GDP ratio is
(Multiple Choice)
4.8/5 (31)
Suppose the stock of government debt in Canada at the end of one fiscal year is $475 billion.If the stock of debt falls to $461 billion by the end of the next fiscal year,then we know that in that year
(Multiple Choice)
4.7/5 (29)
Consider a government with a positive stock of debt.If the growth rate of real GDP exceeds the real rate of interest on government bonds,then to keep the debt-to-GDP ratio constant the
(Multiple Choice)
4.7/5 (45)
The Canadian tax and transfer system acts as an automatic stabilizer because
(Multiple Choice)
4.8/5 (34)
Most economists believe that balancing the government budget over the business cycle,rather than for each fiscal year,
(Multiple Choice)
4.9/5 (31)
Filters
- Essay(0)
- Multiple Choice(0)
- Short Answer(0)
- True False(0)
- Matching(0)