Exam 32: The Gains From International Trade
Exam 1: Economic Issues and Concepts130 Questions
Exam 2: Economic Theories,Data,and Graphs140 Questions
Exam 3: Demand, Supply, and Price161 Questions
Exam 4: Elasticity160 Questions
Exam 5: Price Controls and Market Efficiency125 Questions
Exam 6: Consumer Behaviour140 Questions
Exam 7: Producers in the Short Run144 Questions
Exam 8: Producers in the Long Run141 Questions
Exam 9: Competitive Markets154 Questions
Exam 10: Monopoly, cartels, and Price Discrimination126 Questions
Exam 11: Imperfect Competition and Strategic Behaviour126 Questions
Exam 12: Economic Efficiency and Public Policy123 Questions
Exam 13: How Factor Markets Work123 Questions
Exam 14: Labour Markets and Income Inequality119 Questions
Exam 15: Interest Rates and the Capital Market107 Questions
Exam 16: Market Failures and Government Intervention123 Questions
Exam 17: The Economics of Environmental Protection133 Questions
Exam 18: Taxation and Public Expenditure121 Questions
Exam 19: What Macroeconomics Is All About116 Questions
Exam 20: The Measurement of National Income117 Questions
Exam 21: The Simplest Short-Run Macro Model156 Questions
Exam 22: Adding Government and Trade to the Simple Macro Model132 Questions
Exam 23: Output and Prices in the Short Run142 Questions
Exam 24: From the Short Run to the Long Run: The Adjustment of Factor Prices149 Questions
Exam 25: Long-Run Economic Growth129 Questions
Exam 26: Money and Banking129 Questions
Exam 27: Money, Interest Rates, and Economic Activity135 Questions
Exam 28: Monetary Policy in Canada119 Questions
Exam 29: Inflation and Disinflation122 Questions
Exam 30: Unemployment Fluctuations and the Nairu120 Questions
Exam 31: Government Debt and Deficits129 Questions
Exam 32: The Gains From International Trade127 Questions
Exam 33: Trade Policy126 Questions
Exam 34: Exchange Rates and the Balance of Payments161 Questions
Select questions type
If the index of export prices for Country X increases from 120 to 150 and the index of import prices increases from 100 to 125,it may be said that
Free
(Multiple Choice)
4.9/5  (32)
(32)
Correct Answer: Verified
C
Since 1950,the world's real GDP has increased by seven times and the volume of world trade has increased by roughly
Free
(Multiple Choice)
4.9/5 (41)
Correct Answer:Verified
E
The "terms of trade" reflect the
Free
(Multiple Choice)
4.8/5 (30)
Correct Answer:Verified
D
Australia exports wine to Canada,and Canada also exports wine to Australia.This is a(n)
(Multiple Choice)
4.9/5 (30)
If Country A has a comparative advantage in the production of oil relative to Country B,then
(Multiple Choice)
4.9/5 (34)
The following production possibilities schedule shows the quantities of wheat and rice that can be produced in Canada and India with one unit of equivalent resources.
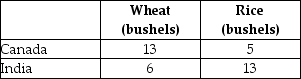 TABLE 32-2
-Refer to Table 32-2.To achieve the potential gains from international trade,
TABLE 32-2
-Refer to Table 32-2.To achieve the potential gains from international trade,
(Multiple Choice)
4.8/5 (30)
One region is said to have an absolute advantage over another region in the production of good X when
(Multiple Choice)
4.8/5 (34)
A country that engages in no foreign trade is said to be in a situation of
(Multiple Choice)
4.8/5 (33)
The diagram below shows the (hypothetical)demand and supply curves for regional jets in Canada.Assume that the market is competitive,all jets are identical,and that Canada engages in international trade. 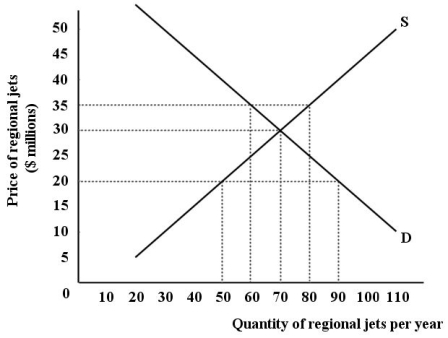 FIGURE 32-6
-Refer to Figure 32-6.Assume the world price of a regional jet is $20 million.Further,suppose that Canada disallowed international trade in regional jets and Canadian consumers purchase the domestic equilibrium quantity of jets from domestic suppliers.What is the total additional expenditure Canadian consumers will pay in this no-trade situation versus the amount they would pay for the same quantity at the world price?
FIGURE 32-6
-Refer to Figure 32-6.Assume the world price of a regional jet is $20 million.Further,suppose that Canada disallowed international trade in regional jets and Canadian consumers purchase the domestic equilibrium quantity of jets from domestic suppliers.What is the total additional expenditure Canadian consumers will pay in this no-trade situation versus the amount they would pay for the same quantity at the world price?
(Multiple Choice)
4.9/5 (32)
Canadian politicians who promoted the NAFTA in the early 1990s claimed that Canadian producers would have access to a larger market and thus costs would decline.Which of the following sources of the gains from trade are implied by this statement?
(Multiple Choice)
4.8/5 (35)
The following production possibilities schedule shows the quantities of soybeans and oil that can each be produced in Canada and Mexico with one unit of equivalent resources.
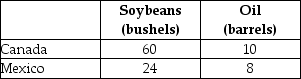 TABLE 32-3
-Refer to Table 32-3.If Canada were to transfer half a unit of resources from oil to soybeans and Mexico were to transfer one unit of resources from soybeans to oil,the effect on the total output of the two countries would be as follows:
TABLE 32-3
-Refer to Table 32-3.If Canada were to transfer half a unit of resources from oil to soybeans and Mexico were to transfer one unit of resources from soybeans to oil,the effect on the total output of the two countries would be as follows:
(Multiple Choice)
4.9/5 (38)
This table shows how much cotton and cocoa can be produced in Peru and Brazil with one unit of equivalent resources.
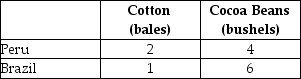 TABLE 32-4
-Refer to Table 32-4.Compared with Peru,Brazil has
TABLE 32-4
-Refer to Table 32-4.Compared with Peru,Brazil has
(Multiple Choice)
4.9/5 (34)
The concept of comparative advantage in international trade is based on ________ as opposed to absolute costs.
(Multiple Choice)
4.9/5 (36)
According to David Ricardo's principle of comparative advantage,there will be gains from international trade
(Multiple Choice)
4.8/5 (32)
The diagram below shows Robinson Crusoe's annual production possibilities boundary for the production of bananas and coconuts. 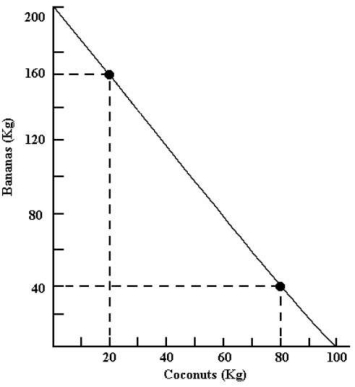 FIGURE 32-3
-Refer to Figure 32-3.Starting from point A and moving to point B,Robinson Crusoe's opportunity cost of producing each additional kilogram of coconuts is
FIGURE 32-3
-Refer to Figure 32-3.Starting from point A and moving to point B,Robinson Crusoe's opportunity cost of producing each additional kilogram of coconuts is
(Multiple Choice)
4.8/5 (37)
The diagram below shows the (hypothetical)demand and supply curves for regional jets in Canada.Assume that the market is competitive,all jets are identical,and that Canada engages in international trade. FIGURE 32-6
-Refer to Figure 32-6.If the world price of a regional jet is $35 million,Canada will
(Multiple Choice)
4.8/5 (36)
Ireland and Japan are assumed to produce only wool and steel,to have full employment and complete mobility of resources between industries.Their production possibilities boundaries before trade are drawn in solid lines.It is assumed that the two countries have the same amount of resources.Their consumption possibilities after trade are shown by the dotted lines.The outputs of wool and steel are given in physical units. 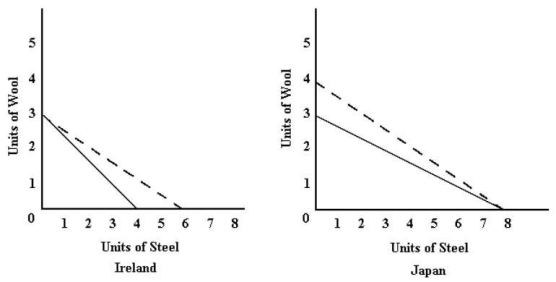 FIGURE 32-1
-Refer to Figure 32-1.Japan has an absolute advantage in
FIGURE 32-1
-Refer to Figure 32-1.Japan has an absolute advantage in
(Multiple Choice)
4.7/5 (39)
This table shows how much wine and cheese can be produced in Spain and Portugal with one unit of equivalent resources.Initially there is no trade.Once trade opens up,transportation costs are assumed to be zero.
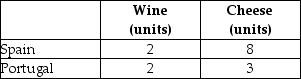 TABLE 32-5
-Refer to Table 32-5.The comparative advantage in cheese is held by
TABLE 32-5
-Refer to Table 32-5.The comparative advantage in cheese is held by
(Multiple Choice)
4.7/5 (38)
The diagram below shows the (hypothetical)demand and supply curves for regional jets in Canada.Assume that the market is competitive,all jets are identical,and that Canada engages in international trade. FIGURE 32-6
-Refer to Figure 32-6.If the world price of a regional jet is $30 million,Canada will
(Multiple Choice)
4.8/5 (38)
Filters
- Essay(0)
- Multiple Choice(0)
- Short Answer(0)
- True False(0)
- Matching(0)