Exam 13: Pearson Correlation and Regression: Inferential Aspects
Exam 1: Introduction and Mathematical Preliminaries146 Questions
Exam 2: Frequency and Probability Distributions150 Questions
Exam 3: Measures of Central Tendency and Variability154 Questions
Exam 4: Percentiles,percentile Ranks,standard Scores,and the Normal Distribution176 Questions
Exam 5: Pearson Correlation and Regression: Descriptive Aspects152 Questions
Exam 6: Probability149 Questions
Exam 7: Estimation and Sampling Distributions151 Questions
Exam 8: Hypothesis Testing: Inferences About a Single Mean160 Questions
Exam 9: Principles of Research Design and Statistical Preliminaries for Analyzing Bivariate Relationships150 Questions
Exam 10: Independent Groups T-Test149 Questions
Exam 11: Correlated Groups T-Test125 Questions
Exam 12: One-Way Repeated Measures Analysis of Variance140 Questions
Exam 13: Pearson Correlation and Regression: Inferential Aspects143 Questions
Exam 14: Chi-Square Test145 Questions
Exam 15: Nonparametric Statistics135 Questions
Exam 16: Two-Way Between-Subjects Analysis of Variance117 Questions
Exam 17: Overview and Extension: Statistical Tests for More Complex Designs124 Questions
Select questions type
Imagine you are interested in researching the relationship between job experience and income among early-career working professionals.You take a random sample of 32 professionals from the nearest city,and you ask them to report their annual income and submit a resumé outlining their professional experience.You later calculate their years of experience from their resumés.You compute the following information: 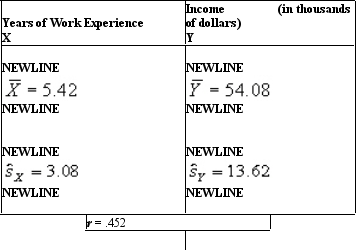 If you were to calculate a 95% confidence interval for this correlation coefficient,you would find that it ranges from .11 to .70.How should this interval be interpreted?
(Multiple Choice)
4.8/5  (34)
(34)
Based on the Applications to the Analysis of Social Problems section of Chapter 14,a smoothing technique
(Multiple Choice)
4.9/5 (34)
The assumption that the population distributions of X and Y are such that their joint
distribution (that is,their scatterplot)represents a bivariate normal distribution implies
that the distribution of Y scores at any value of X is normal in the population.
(True/False)
4.8/5 (30)
If an experimental research strategy was used (i.e.,random assignment and control of extraneous variables),then causality can be inferred from a statistically significant correlation.
(True/False)
4.8/5 (34)
Which of the following is formally known as the coefficient of determination?
(Multiple Choice)
4.8/5 (32)
We can test the null hypothesis that ñ = 0 by transforming the sample correlation coefficient into a statistic that has a sampling distribution that closely approximates the _____ distribution with _____ degrees of freedom.
(Multiple Choice)
4.7/5 (39)
An investigation of the relationship between years of formal education and IQ that was conducted with a sample size of 100 found a statistically significant correlation of .25.Another investigation of the same relationship had the same r value based on a sample size of 10,but it was not statistically significant.Why might this be?
(Multiple Choice)
4.9/5 (33)
If a relationship is observed between two variables in a set of sample data,this means that
a relationship exists between the variables in the corresponding population.
(True/False)
4.9/5 (31)
In terms of regression,the criterion variable is ____ while the predictor variable is _____.
(Multiple Choice)
4.9/5 (34)
Suppose you were interested in conducting a study examining how ratings of similarity between oneself and another person were related to how attracted one is to the other person.You conduct this study by giving participants a description of a person named "Sarah." Participants are asked to read the description and then rate on a scale from 1 to 10 how similar Sarah is to themselves.You also ask each participant to rate on a scale from 1 to 20 how likeable they think Sarah is.
X = rating of similarity to oneself
Y = rating of likability of the target ("Sarah")
62 people participate in your study,and you obtain the following data:
SCP = 66
SSX = 40
SSY = 136
Calculate the Pearson correlation coefficient (r)for the above data.
(Short Answer)
4.9/5 (28)
Suppose you were interested in conducting a study examining how ratings of similarity between oneself and another person were related to how attracted one is to the other person.You conduct this study by giving participants a description of a person named "Sarah." Participants are asked to read the description and then rate on a scale from 1 to 10 how similar Sarah is to themselves.You also ask each participant to rate on a scale from 1 to 20 how likeable they think Sarah is.
X = rating of similarity to oneself
Y = rating of likability of the target ("Sarah")
62 people participate in your study,and you obtain the following data:
SCP = 66
SSX = 40
SSY = 136
Using your calculations above,if you asked another person who was not in your original experiment to rate the similarity between themselves and "Sarah" on the same scale from 1 to 10,and their rating of similarity = 5,what would you predict their likability rating to be?
(Short Answer)
4.8/5 (26)
A positive correlation between height and weight would indicate that _____.
(Multiple Choice)
4.7/5 (33)
Imagine you are interested in researching the relationship between job experience and income among early-career working professionals.You take a random sample of 32 professionals from the nearest city,and you ask them to report their annual income and submit a resumé outlining their professional experience.You later calculate their years of experience from their resumés.You compute the following information:  How would you state the null hypothesis for this test?
(Multiple Choice)
4.7/5 (38)
A regression equation can be used to identify the value of Y that is predicted to be paired
with an individual's score on X.
(True/False)
4.9/5 (31)
Suppose a school psychologist found a correlation between SAT scores of students who graduated from her school and their GPAs at the end of the first year in college.The correlation,r = .82,was based on a sample of 55 students whose SAT scores ranged from 450 to 550.The next year,one for her students made a 625 on the SAT and she wants to predict that students future GPA.Which of the following statements is true?
(Multiple Choice)
4.8/5 (26)
The Pearson correlation cannot be used to determine the relationship between two variables when _____.
(Multiple Choice)
4.8/5 (36)
In hypothesis testing for the correlation,if the null hypothesis is rejected and the sample correlation coefficient is positive,this indicates that in the population the correlation coefficient is also ____________________.
(Short Answer)
4.8/5 (43)
Filters
- Essay(0)
- Multiple Choice(0)
- Short Answer(0)
- True False(0)
- Matching(0)