Exam 3: Describing Data Using Numerical Measures
Exam 1: The Where, why, and How of Data Collection167 Questions
Exam 2: Graphs,charts and Tablesdescribing Your Data138 Questions
Exam 3: Describing Data Using Numerical Measures130 Questions
Exam 4: Using Probability and Probability Distributions77 Questions
Exam 5: Discrete Probability Distributions119 Questions
Exam 6: Introduction to Continuous Probability Distributions90 Questions
Exam 7: Introduction to Sampling Distributions104 Questions
Exam 8: Estimating Single Population Parameters145 Questions
Exam 9: Introduction to Hypothesis Testing129 Questions
Exam 10: Estimation and Hypothesis Testing for Two Population Parameters97 Questions
Exam 11: Hypothesis Tests and Estimation for Population Variances71 Questions
Exam 12: Analysis of Variance137 Questions
Exam 13: Goodness-Of-Fit Tests and Contingency Analysis104 Questions
Exam 14: Introduction to Linear Regression and Correlation Analysis136 Questions
Exam 15: Multiple Regression Analysis and Model Building153 Questions
Exam 16: Analyzing and Forecasting Time-Series Data133 Questions
Exam 17: Introduction to Nonparametric Statistics104 Questions
Exam 18: Introduction to Quality and Statistical Process Control110 Questions
Exam 19: Introduction to Decision Analysis116 Questions
Select questions type
The following data reflect the number of customers who test drove new cars each day for a sample of 20 days at the Redfield Ford Dealership. 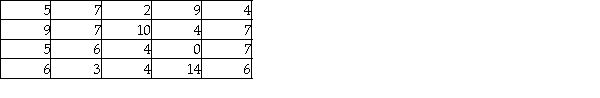 Given these data,what is the variance?
Free
(Multiple Choice)
4.8/5  (37)
(37)
Correct Answer: Verified
C
If a set of data has 540 values,the 3rd quartile corresponds to approximately the 135th value when the data have been arranged in numerical order.
Free
(True/False)
4.8/5 (26)
Correct Answer:Verified
False
The following data reflect the number of customers who return merchandise for a refund on Monday.Note these data reflect the population of all 10 Mondays for which data data are available.  Based on these data,what is the standard deviation?
Free
(Multiple Choice)
4.9/5 (32)
Correct Answer:Verified
B
The interquartile range contains the middle 50 percent of a data set.
(True/False)
4.8/5 (37)
The marketing manager for Voice-talk,a cell phone company,has taken a sample of 300 customers from the list of 4,356 total customers.The mean monthly bill for the last October based on the sample data is $45.62.The manager should realize that the mean bill for all 4,356 customers will actually be higher than $45.62.
(True/False)
4.8/5 (36)
Suppose a distribution has a mean of 80 and standard deviation of 10.It is found that 84 percent of the values in the data set lie between 70 and 90.This implies that the distribution is not bell-shaped.
(True/False)
4.9/5 (32)
When surveyed,a sample of 1,250 patients at a regional hospital provided interviewers with the following summary statistics pertaining to the hospital charges:
Minimum = $278.00 Q1 = $1,245 Q2 = $3,567 Q3= $4,702.
Based on these data,if you were to construct a box and whisker plot,the value corresponding to the right-hand edge of the box would be $4,702.
(True/False)
4.8/5 (35)
When analyzing annual incomes of adults in a market area,the marketing manager's report indicated that the 90th percentile is $123,400.That means that 90 percent of the adult incomes in the market area fall at or below $123,400.
(True/False)
5.0/5 (36)
Recently an article in a newspaper stated that 75 percent of the households in the state had incomes of $20,200 or below.Given this input,it is certain that mean household income is less than $20,200.
(True/False)
4.9/5 (31)
When a variance is calculated for a data set,the resulting value is the same regardless of whether the data set is treated as a population or a sample.
(True/False)
4.9/5 (34)
The Good-Guys Car Dealership has tracked the number of used cars sold at its downtown dealership.Consider the following data as representing the population of cars sold in each of the 8 weeks that the dealership has been open.  The population range is 9.
(True/False)
4.8/5 (28)
Acme Taxi has two taxi cabs.The manager tracks the daily revenue for each cab.Over the past 20 days,Cab A has averaged $76.00 per night with a standard deviation equal to $11.00.Cab B has averaged $200.00 per night with a standard deviation of $18.00.Based on this information,the coefficient of variation for Cab B is 9 percent.
(True/False)
4.9/5 (37)
The advantage of using the interquartile range versus the range as a measure of variation is:
(Multiple Choice)
4.8/5 (37)
The asking price for homes on the real estate market in Baltimore has a mean value of $286,455 and a standard deviation of $11,200.Four homes are listed by one real estate company with the following prices: 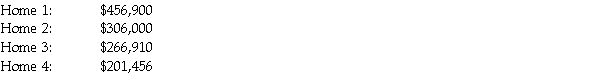 Based upon this information,which house has a standardized value that is relatively closest to zero?
(Multiple Choice)
5.0/5 (35)
A sample of people who have attended a college football game at your university has a mean = 3.2 members in their family.The mode number of family members is 2 and the median number is 2.0.Based on this information:
(Multiple Choice)
4.8/5 (39)
A recent study involving a sample of 3,000 vehicles in California showed the following statistics related to the number of miles driven per day: Q1 = 12 Q2 = 45 and Q3 = 56.Based on these data,if a box and whisker plot is developed,the right-hand whisker value is 122 miles.
(True/False)
4.9/5 (34)
Consider the following sample data:  For these data the median is:
(Multiple Choice)
4.8/5 (31)
You are given the following data:  Assuming that these data reflect the population of interest,these data can be considered symmetric.
(True/False)
4.8/5 (27)
The following sample data reflect electricity bills for ten households in San Diego in March.  Compute the range,variance,and standard deviation for these sample data.Discuss which of these three measures you would prefer to use as a measure of variation.
(Essay)
4.8/5 (28)
Filters
- Essay(0)
- Multiple Choice(0)
- Short Answer(0)
- True False(0)
- Matching(0)