Exam 16: Analyzing and Forecasting Time-Series Data
Exam 1: The Where, why, and How of Data Collection167 Questions
Exam 2: Graphs,charts and Tablesdescribing Your Data138 Questions
Exam 3: Describing Data Using Numerical Measures130 Questions
Exam 4: Using Probability and Probability Distributions77 Questions
Exam 5: Discrete Probability Distributions119 Questions
Exam 6: Introduction to Continuous Probability Distributions90 Questions
Exam 7: Introduction to Sampling Distributions104 Questions
Exam 8: Estimating Single Population Parameters145 Questions
Exam 9: Introduction to Hypothesis Testing129 Questions
Exam 10: Estimation and Hypothesis Testing for Two Population Parameters97 Questions
Exam 11: Hypothesis Tests and Estimation for Population Variances71 Questions
Exam 12: Analysis of Variance137 Questions
Exam 13: Goodness-Of-Fit Tests and Contingency Analysis104 Questions
Exam 14: Introduction to Linear Regression and Correlation Analysis136 Questions
Exam 15: Multiple Regression Analysis and Model Building153 Questions
Exam 16: Analyzing and Forecasting Time-Series Data133 Questions
Exam 17: Introduction to Nonparametric Statistics104 Questions
Exam 18: Introduction to Quality and Statistical Process Control110 Questions
Exam 19: Introduction to Decision Analysis116 Questions
Select questions type
The Gilbert Company chief financial officer has been tracking annual sales for each of the company's three divisions for the past 10 years.At a recent meeting,he pointed to the annual data and indicated that it clearly showed the seasonality associated with its business.Given the data,this statement may have been very appropriate.
Free
(True/False)
5.0/5  (33)
(33)
Correct Answer: Verified
False
In using simple linear regression to find the linear trend in an annual time series from 1990 to 2005,the values 1990,1991,etc.are used as the values of the independent variable t when the regression is conducted.
Free
(True/False)
4.7/5 (32)
Correct Answer:Verified
False
If you suspect that your time-series data has a strong downward trend,you should set the beta smoothing constant at value fairly close to negative 1.0.
Free
(True/False)
4.8/5 (32)
Correct Answer:Verified
False
The All American Toy Company has records for quarterly sales for the past 4 years.These data are shown as follows: 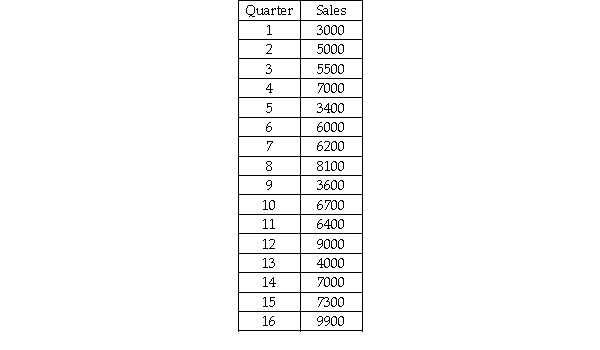 Given these data,develop a forecast for quarter 17 using a double exponential smoothing model with alpha = 0.20,beta = 0.30 and starting values for C and T based on the linear trend regression model for periods 1-16.
(Essay)
4.7/5 (26)
A company has a monthly time series that regularly shows sales being higher in the summer months.This is an example of which component?
(Multiple Choice)
4.9/5 (32)
Which of the following is true regarding the MSE and MAD in forecasting?
(Multiple Choice)
4.9/5 (36)
The Morgan Company is interested in developing a forecast for next month's sales.It has collected sales data for the past 12 months. 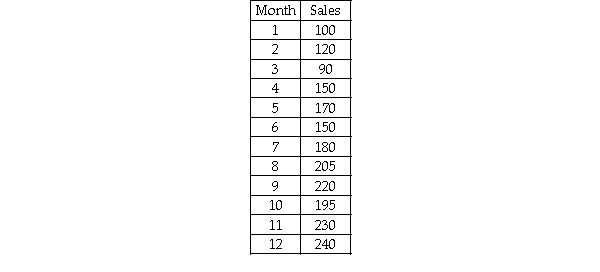 After analyzing these data,if the company wishes to use exponential smoothing,it should employ a single smoothing model since there is evidence of a linear trend in the data.
(True/False)
4.9/5 (36)
A company has developed a linear trend model to forecast monthly sales.The following data show the actual sales and the "fitted" sales for months 1-12. 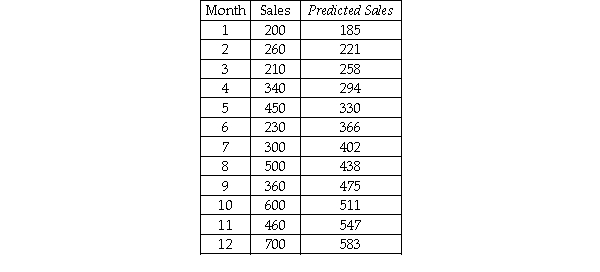 Based on these data,what is the mean square error for the linear trend model?
(Multiple Choice)
4.8/5 (30)
The Boxer Company has been in business since 1998.The following sales data are recorded by quarter for the years 1999-2001. 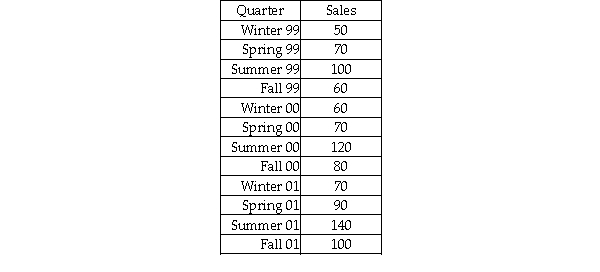 The managers at the company wish to determine the seasonal indexes for each quarter during the year.The index for the summer quarter is:
(Multiple Choice)
4.9/5 (30)
The following output is provided for a linear trend regression-based forecasting model based on 12 months of data: 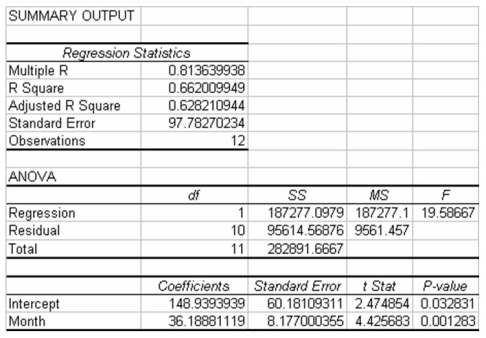 Suppose that the actual sales for months 13-15 are: 720,680,800.Given this,which of the following is the forecast bias value for months 13-15?
(Multiple Choice)
4.9/5 (36)
A company has recorded annual sales for the past 14 years and found the following linear trend model:  = 5.23 + 144.60t.This means that:
(Multiple Choice)
4.8/5 (36)
Gibson,Inc.is a holding company that owns several businesses.One such business is a truck sales company.To help in managing this operation,managers at Gibson have collected sales data for the past 20 years showing the number of trucks sold each year.They have then developed the linear trend forecasting model shown as follows: 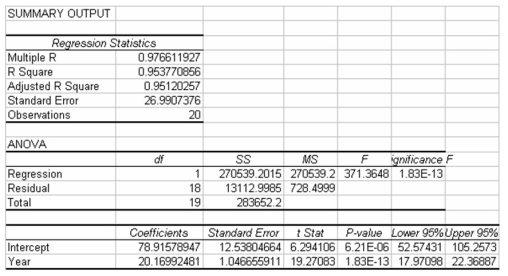 Based on this information,it appears that the time series has a strong positive linear trend component.
(True/False)
4.8/5 (38)
If a time series contains substantial irregular movement,the smoothing constant for a single exponential smoothing model that is close to 1.0 will result in forecasts that are not as smoothed out as those that would occur if a smaller smoothing constant was used.
(True/False)
4.8/5 (39)
A company has developed a linear trend regression model based on 16 quarters of data.The independent variable is the measure of time (t = 1 thru 16 where quarter 1 is winter quarter,2 is spring,etc.).The company has also developed seasonal indexes for each quarter as follows:  The linear trend forecast equation is:
  = 120 + 56t. Given this information,which of the four quarters beginning next winter (period t = 17)will have the highest seasonally adjusted forecast?
(Multiple Choice)
4.8/5 (33)
It is possible to use linear regression analysis to develop a forecasting model for nonlinear data if we can effectively transform the data.
(True/False)
4.8/5 (28)
Two common unweighted indexes are the Paasche Index and the Laspeyres Index.
(True/False)
4.7/5 (41)
Which of the following statistical measures is used to help decision makers assess the potential for their model to provide usable forecasts?
(Multiple Choice)
4.8/5 (38)
The process of selecting the forecasting technique to use in a particular application is called:
(Multiple Choice)
4.8/5 (33)
In a recent meeting,the sales manager for a drug company stated that she needed to have a forecast prepared for each week for the next six weeks.The week in this case is the:
(Multiple Choice)
4.9/5 (28)
The reason for using split samples in developing a forecasting model is to eliminate the potential for bias in the resulting model.
(True/False)
4.8/5 (39)
Filters
- Essay(0)
- Multiple Choice(0)
- Short Answer(0)
- True False(0)
- Matching(0)