Exam 3: Describing Data Using Numerical Measures
Exam 1: The Where, why, and How of Data Collection167 Questions
Exam 2: Graphs,charts and Tablesdescribing Your Data138 Questions
Exam 3: Describing Data Using Numerical Measures130 Questions
Exam 4: Using Probability and Probability Distributions77 Questions
Exam 5: Discrete Probability Distributions119 Questions
Exam 6: Introduction to Continuous Probability Distributions90 Questions
Exam 7: Introduction to Sampling Distributions104 Questions
Exam 8: Estimating Single Population Parameters145 Questions
Exam 9: Introduction to Hypothesis Testing129 Questions
Exam 10: Estimation and Hypothesis Testing for Two Population Parameters97 Questions
Exam 11: Hypothesis Tests and Estimation for Population Variances71 Questions
Exam 12: Analysis of Variance137 Questions
Exam 13: Goodness-Of-Fit Tests and Contingency Analysis104 Questions
Exam 14: Introduction to Linear Regression and Correlation Analysis136 Questions
Exam 15: Multiple Regression Analysis and Model Building153 Questions
Exam 16: Analyzing and Forecasting Time-Series Data133 Questions
Exam 17: Introduction to Nonparametric Statistics104 Questions
Exam 18: Introduction to Quality and Statistical Process Control110 Questions
Exam 19: Introduction to Decision Analysis116 Questions
Select questions type
It is possible for a set of data to have multiple modes as well as multiple medians,but there can be only one mean.
(True/False)
4.8/5  (30)
(30)
Based on the empirical rule we can expect about 95 percent of the values in bell-shaped distribution to be within one standard deviation of the mean.
(True/False)
4.8/5 (31)
The following data reflect the number of customers who test drove new cars each day for a sample of 20 days at the Redfield Ford Dealership. 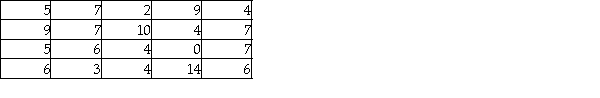 Given these data,what is the interquartile range?
(Multiple Choice)
4.7/5 (42)
A distribution is said to be symmetric when the sample mean and the population mean are equal.
(True/False)
4.7/5 (31)
The Good-Guys Car Dealership has tracked the number of used cars sold at its downtown dealership.Consider the following data as representing the population of cars sold in each of the 8 weeks that the dealership has been open.  The population variance is approximately 9.43.
(True/False)
4.8/5 (28)
The owner of a local gasoline station has kept track of the number of gallons of regular unleaded sold at his station every day since he purchased the station.This morning,he computed the mean number of gallons.This value would be considered a statistic.
(True/False)
4.8/5 (30)
Consider a situation involving two populations where population 1 is known to have a higher coefficient of variation than population 2.In this situation,we know that population 1 has a higher standard deviation than population 2.
(True/False)
4.8/5 (38)
Incomes in a particular market area are known to be right-skewed with a mean equal to $33,100.In a report issued recently,a manager stated that at least 89 percent of all incomes are in the range of $26,700 to $39,500,and this was based on Tchebysheff's theorem.Given these facts,what is the standard deviation for the incomes in this market area?
(Multiple Choice)
4.8/5 (29)
The distribution of actual weight of potato chips in a 16 ounce sack is thought to be bell-shaped with a mean equal to 16 ounces and a standard deviation equal to 0.45 ounces.Based on this,between what two limits could we expect 95 percent of all sacks to weigh?
(Multiple Choice)
4.9/5 (42)
Populations with larger means will also have larger standard deviations since the data will be more spread out for populations with larger means.
(True/False)
4.9/5 (30)
Filters
- Essay(0)
- Multiple Choice(0)
- Short Answer(0)
- True False(0)
- Matching(0)