Exam 15: Multiple Regression Analysis and Model Building
Exam 1: The Where, why, and How of Data Collection167 Questions
Exam 2: Graphs,charts and Tablesdescribing Your Data138 Questions
Exam 3: Describing Data Using Numerical Measures130 Questions
Exam 4: Using Probability and Probability Distributions77 Questions
Exam 5: Discrete Probability Distributions119 Questions
Exam 6: Introduction to Continuous Probability Distributions90 Questions
Exam 7: Introduction to Sampling Distributions104 Questions
Exam 8: Estimating Single Population Parameters145 Questions
Exam 9: Introduction to Hypothesis Testing129 Questions
Exam 10: Estimation and Hypothesis Testing for Two Population Parameters97 Questions
Exam 11: Hypothesis Tests and Estimation for Population Variances71 Questions
Exam 12: Analysis of Variance137 Questions
Exam 13: Goodness-Of-Fit Tests and Contingency Analysis104 Questions
Exam 14: Introduction to Linear Regression and Correlation Analysis136 Questions
Exam 15: Multiple Regression Analysis and Model Building153 Questions
Exam 16: Analyzing and Forecasting Time-Series Data133 Questions
Exam 17: Introduction to Nonparametric Statistics104 Questions
Exam 18: Introduction to Quality and Statistical Process Control110 Questions
Exam 19: Introduction to Decision Analysis116 Questions
Select questions type
A major car magazine has recently collected data on 30 leading cars in the U.S.market.It is interested in building a multiple regression model to explain the variation in highway miles.The following correlation matrix has been computed from the data collected: 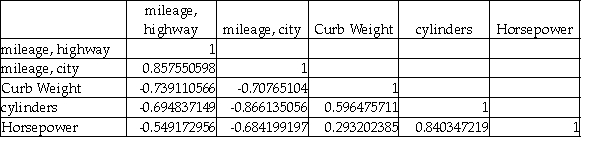 The analysts also produced the following multiple regression output using curb weight,cylinders,and horsepower as the three independent variables.Note,a number of the output fields are missing,but can be determined from the information provided.
  Based on the information provided,the 95 percent confidence interval estimate for regression slope coefficient for horsepower is approximately - 0.041 DASH 0.009 and since this interval crosses zero,we are unable to conclude that the regression slope coefficient for this variable is different from zero.
Free
(True/False)
4.9/5  (26)
(26)
Correct Answer: Verified
True
The standard error of the estimate is a term that is used for the standard deviation of the residuals in a multiple regression model.
Free
(True/False)
4.8/5 (41)
Correct Answer:Verified
True
It is possible for the standard error of the estimate to actually increase if variables are added to the model that do not aid in explaining the variation in the dependent variable.
Free
(True/False)
4.8/5 (41)
Correct Answer:Verified
True
The following residual plot is an output of a regression model.  Based on this residual plot,there is evidence to suggest that the underlying relationship between the y variable and the x variable is nonlinear.
(True/False)
4.9/5 (39)
A study has recently been conducted by a major computer magazine publisher in which the objective was to develop a multiple regression model to explain the variation in price of personal computers.Three independent variables were used.The following computer printout shows the final output.However,several values are omitted from the printout.  Given this information,the regression model explains just under 70 percent of the variation in the price of personal computers.
(True/False)
4.9/5 (26)
Based on the correlations below:
Y
X1 0.8
X2 0.7
we could say that x1 accounts for 64 percent of the variation in y and x2 accounts for 49 percent of the variation in y.So if both x's are included in a multiple regression model,then the resulting R-square = 1.13.
(True/False)
4.8/5 (28)
A regression equation that predicts the price of homes in thousands of dollars is  = 24.6 + 0.055x1 - 3.6x2,where x2 is a dummy variable that represents whether the house is on a busy street or not.Here x2 = 1 means the house is on a busy street and x2 = 0 means it is not.From this we can conclude that on average homes that are on busy streets are worth $3600 more than homes that are not on busy streets.
(True/False)
4.9/5 (28)
A forecasting model of the following form was developed: y =  +
+  +
+  +
+  + ε
Which of the following best describes the form of this model?
+ ε
Which of the following best describes the form of this model?
(Multiple Choice)
4.9/5 (37)
Based on the residual plot below,which of the following is correct? 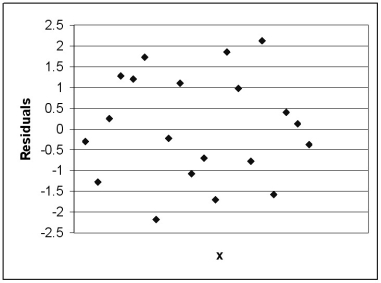 The above residual plot shows:
(Multiple Choice)
4.9/5 (44)
The following regression output is from a multiple regression model: 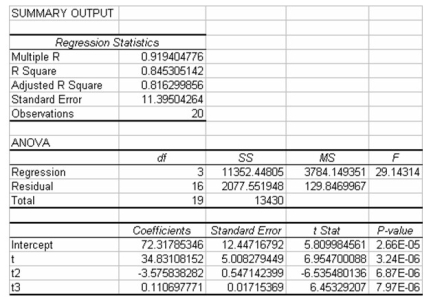 The variables t,t2,and t3 represent the t,t-squared,and t-cubed respectively where t is the indicator of time from periods t = 1 to t = 20.Which of the following best describes the type of forecasting model that has been developed?
(Multiple Choice)
4.9/5 (27)
On a survey there is a question that asks whether someone lives in a house,apartment,or condominium.These three responses could be coded in a dummy variable using value 0,1,and 2.
(True/False)
4.9/5 (34)
Standard stepwise regression combines attributes of both forward selection and backward elimination.
(True/False)
4.8/5 (43)
In a multiple regression,the dependent variable is house value (in '000$)and one of the independent variables is a dummy variable,which is defined as 1 if a house has a garage and 0 if not.The coefficient of the dummy variable is found to be 5.4 but the t-test reveals that it is not significant at the 0.05 level.Which of the following is true?
(Multiple Choice)
5.0/5 (38)
In a study of employees at a local company,the human resource manager wants to develop a multiple regression model to explain the difference in employee wage rates.She is thinking of including a variable,degree status,in which the following categories exist: no degree,H.S.degree,junior college degree,bachelor degree,graduate degree.Two other variables are being considered; Age and Years With the Company.Given this,the appropriate number of variables in the model will be six.
(True/False)
4.8/5 (39)
Under what circumstances does the variance inflation factor signal that multicollinearity may be a problem?
(Multiple Choice)
4.9/5 (42)
A study has recently been conducted by a major computer magazine publisher in which the objective was to develop a multiple regression model to explain the variation in price of personal computers.Three independent variables were used.The following computer printout shows the final output.However,several values are omitted from the printout. 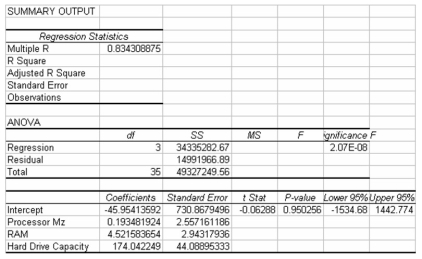 Given this information,the calculated test statistic for the regression slope coefficient on the variable RAM,is approximately 1.54.
(True/False)
4.9/5 (30)
If a polynomial model has a larger R-square than a linear model for the same set of data,this is one indication that the polynomial model fits the data better than the linear model.
(True/False)
4.9/5 (39)
One of the variables that are being considered for inclusion in a multiple regression model is marital status of the customer.There are four possible responses listed for this variable.Based on this,four dummy variables will need to be created and incorporated into the regression model.
(True/False)
4.9/5 (33)
A major car magazine has recently collected data on 30 leading cars in the U.S.market.It is interested in building a multiple regression model to explain the variation in highway miles.The following correlation matrix has been computed from the data collected:  The analysts also produced the following multiple regression output using curb weight,cylinders,and horsepower as the three independent variables.Note,a number of the output fields are missing,but can be determined from the information provided.
 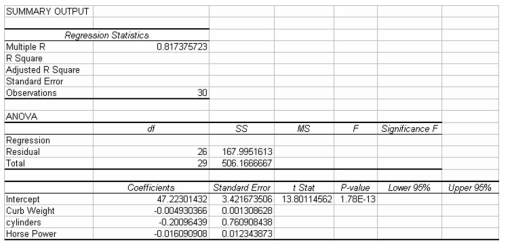 Based on the information provided,holding the other variables constant,increasing horsepower by one unit results in an average decrease in highway mileage by 0.016 miles per gallon.
(True/False)
4.8/5 (27)
Which of the following would best describe the situation that a second-degree polynomial regression equation would be used to model?
(Multiple Choice)
4.8/5 (30)
Filters
- Essay(0)
- Multiple Choice(0)
- Short Answer(0)
- True False(0)
- Matching(0)