Exam 14: Introduction to Linear Regression and Correlation Analysis
Exam 1: The Where, why, and How of Data Collection167 Questions
Exam 2: Graphs,charts and Tablesdescribing Your Data138 Questions
Exam 3: Describing Data Using Numerical Measures130 Questions
Exam 4: Using Probability and Probability Distributions77 Questions
Exam 5: Discrete Probability Distributions119 Questions
Exam 6: Introduction to Continuous Probability Distributions90 Questions
Exam 7: Introduction to Sampling Distributions104 Questions
Exam 8: Estimating Single Population Parameters145 Questions
Exam 9: Introduction to Hypothesis Testing129 Questions
Exam 10: Estimation and Hypothesis Testing for Two Population Parameters97 Questions
Exam 11: Hypothesis Tests and Estimation for Population Variances71 Questions
Exam 12: Analysis of Variance137 Questions
Exam 13: Goodness-Of-Fit Tests and Contingency Analysis104 Questions
Exam 14: Introduction to Linear Regression and Correlation Analysis136 Questions
Exam 15: Multiple Regression Analysis and Model Building153 Questions
Exam 16: Analyzing and Forecasting Time-Series Data133 Questions
Exam 17: Introduction to Nonparametric Statistics104 Questions
Exam 18: Introduction to Quality and Statistical Process Control110 Questions
Exam 19: Introduction to Decision Analysis116 Questions
Select questions type
The standard error of the estimate for a simple linear regression model measures the variation in the slope coefficient from sample to sample.
Free
(True/False)
5.0/5  (38)
(38)
Correct Answer: Verified
False
Given a sample of data for use in simple linear regression,the values for the slope and the intercept are chosen to minimize the sum of squared errors.
Free
(True/False)
4.7/5 (28)
Correct Answer:Verified
True
In analyzing the residuals to determine whether the simple regression analysis satisfies the regression assumptions,which of the following is true?
Free
(Multiple Choice)
4.9/5 (36)
Correct Answer:Verified
D
Use the following regression results to answer the question below. 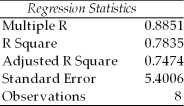 ANOVA
ANOVA 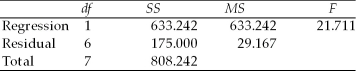
 How many observations were involved in this regression?
(Multiple Choice)
4.9/5 (27)
A recent study of 15 shoppers showed that the correlation between the time spent in the store and the dollars spent was 0.235.Using a significance level equal to 0.05,which of the following is the appropriate null hypothesis to test whether the population correlation is zero?
(Multiple Choice)
5.0/5 (34)
The scatter plot is a two dimensional graph that is used to graphically represent the relationship between two variables.
(True/False)
4.8/5 (30)
State University recently randomly sampled seven students and analyzed grade point average (GPA)and number of hours worked off-campus per week.The following data were observed:  The test statistic for testing whether the two variables are significantly correlated is approximately z = 1.56.
(True/False)
4.7/5 (34)
You are given the following sample data for two variables: 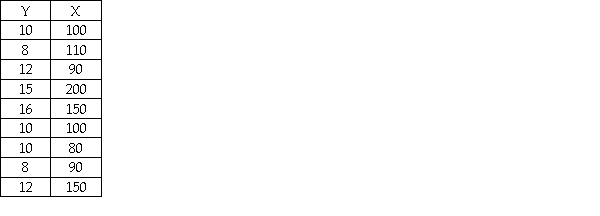 The regression model based on these sample data explains approximately 75 percent of the variation in the dependent variable.
(True/False)
4.7/5 (33)
In developing a scatter plot,the decision maker has the option of connecting the points or not.
(True/False)
4.9/5 (40)
Consider the following partially completed computer printout for a regression analysis where the dependent variable is the price of a personal computer and the independent variable is the size of the hard drive. 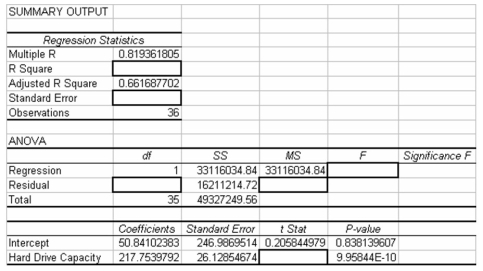 Based on the information provided,what is the F statistic?
(Multiple Choice)
4.8/5 (32)
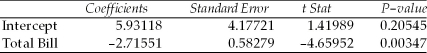
A study was recently performed by the Internal Revenue Service to determine how much tip income waiters and waitresses should make based on the size of the bill at each table.A random sample of bills and resulting tips were collected and the following regression results were observed:
SUMMARY OUTPUT 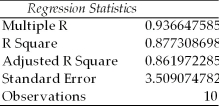 ANOVA
ANOVA 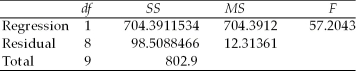
 Given this output,the point estimate for the average tip per dollar amount of the bill is approximately $0.21.
(True/False)
4.8/5 (33)
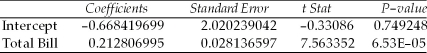
The Public Utility Commission in a southern state is interested in describing the relationship between household monthly utility bills and the size of the house.A recent study of 30 randomly selected household resulted in the following regression results: 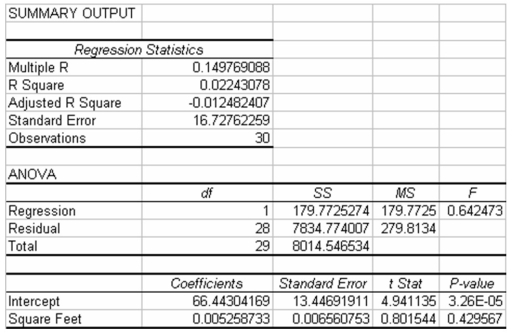 Based on the information provided,indicate what,if any,conclusions can be reached about the relationship between utility bill and the size of the house in square feet.
(Essay)
4.8/5 (37)
If a residual plot exhibits a curved pattern in the residuals,this means that:
(Multiple Choice)
4.9/5 (36)
Assume that we have found a regression equation of  = 3.6 - 2.4x,and that the coefficient of determination is 0.72,then the correlation of x and y must be about 0.849.
(True/False)
4.8/5 (33)
If the sample value of the intercept turns out to be an illogical value,this is acceptable as long as x = 0 is not within the range of the data.
(True/False)
4.8/5 (38)
When a correlation is found between a pair of variables,this always means that there is a direct cause and effect relationship between the variables.
(True/False)
4.9/5 (41)
The following regression model has been computed based on a sample of twenty observations:  = 34.2 + 19.3x.The first observations in the sample for y and x were 300 and 18,respectively.Given this,the residual value for the first observation is approximately 81.6.
(True/False)
4.9/5 (36)
A regression analysis between sales (Y)and advertising (X)(both in dollars)resulted in the following equation:  = 100 + 2000X The above equation implies that an
(Multiple Choice)
4.8/5 (33)
The fact that teachers' salaries in Wisconsin are correlated with egg prices in Texas means that the two variables are spuriously correlated since a change in one variable could not cause the change in the other.
(True/False)
4.8/5 (35)
Filters
- Essay(0)
- Multiple Choice(0)
- Short Answer(0)
- True False(0)
- Matching(0)