Exam 10: Estimation and Hypothesis Testing for Two Population Parameters
Exam 1: The Where, why, and How of Data Collection167 Questions
Exam 2: Graphs,charts and Tablesdescribing Your Data138 Questions
Exam 3: Describing Data Using Numerical Measures130 Questions
Exam 4: Using Probability and Probability Distributions77 Questions
Exam 5: Discrete Probability Distributions119 Questions
Exam 6: Introduction to Continuous Probability Distributions90 Questions
Exam 7: Introduction to Sampling Distributions104 Questions
Exam 8: Estimating Single Population Parameters145 Questions
Exam 9: Introduction to Hypothesis Testing129 Questions
Exam 10: Estimation and Hypothesis Testing for Two Population Parameters97 Questions
Exam 11: Hypothesis Tests and Estimation for Population Variances71 Questions
Exam 12: Analysis of Variance137 Questions
Exam 13: Goodness-Of-Fit Tests and Contingency Analysis104 Questions
Exam 14: Introduction to Linear Regression and Correlation Analysis136 Questions
Exam 15: Multiple Regression Analysis and Model Building153 Questions
Exam 16: Analyzing and Forecasting Time-Series Data133 Questions
Exam 17: Introduction to Nonparametric Statistics104 Questions
Exam 18: Introduction to Quality and Statistical Process Control110 Questions
Exam 19: Introduction to Decision Analysis116 Questions
Select questions type
To increase productivity,workers went through a training program.The management wanted to know the effectiveness of the program.A sample of seven workers was taken and their daily production rates before and after the training are shown below.  Based on the data,the training program is
(Multiple Choice)
4.8/5  (40)
(40)
If we are testing for the difference between the means of two independent populations with samples of n1 = 20 and n2 = 20,the number of degrees of freedom is equal to:
(Multiple Choice)
4.9/5 (32)
When performing a hypothesis test for the difference in the means of two independent populations where the standard deviations are known,it is necessary to use the pooled standard deviation in calculating the test statistic.
(True/False)
4.8/5 (31)
An advertising company has developed a new ad for one of the national car manufacturing companies.The ad agency is interested in testing whether the proportion of favorable response to the ad is the same between male adults versus female adults.It plans on conducting the test using an alpha level equal to 0.05.A sample of 100 adults of each gender will be used in the study.Each person will be asked to view the ad and indicate whether they find the ad to be "pleasing" or not.Given this information,what is the critical value?
(Multiple Choice)
4.8/5 (39)
In estimating the difference between two population means,if a 95 percent confidence interval includes zero,then we can conclude that there is a 95 percent chance that the difference between the two population means is zero.
(True/False)
4.8/5 (37)
The NCAA is interested in estimating the difference in mean number of daily training hours for men and women athletes on college campuses.It wants 95 percent confidence and will select a sample of 10 men and 10 women for the study.The variances are assumed equal and the populations normally distributed.The sample results are:  Based on these data,the lower limit for the difference between population means is 0.15 hours.
(True/False)
4.7/5 (41)
To test whether Model A and Model B cars have the same MPG,the first step is to select two independent random samples of drivers and assign one of them to drive Model A and the other Model B.
(True/False)
4.7/5 (32)
If a manager wishes to develop a confidence interval estimate for estimating the difference between two population means,an increase in the size of the samples used will result in:
(Multiple Choice)
4.8/5 (36)
In testing for differences between the means of two paired populations,the null hypothesis is:
(Multiple Choice)
4.8/5 (40)
The National Football League (NFL)is interested in testing to see whether there is a difference in the proportion of male fans that prefer instant replay to review officials' calls and the proportion of female fans that prefer instant replay.It is believed that males tend to favor the practice to a higher degree than do females.To test this,random samples of male fans and female fans were selected and the following results were obtained:  Using a significance level equal to 0.05,what conclusion should be reached based on the sample data?
(Essay)
4.8/5 (34)
When conducting a hypothesis test to determine whether or not two groups differ,using paired samples rather than independent samples has the advantage of controlling for sources of variation that might distort the conclusions of the study.
(True/False)
4.8/5 (32)
Box-and-whisker plots are often useful for determining whether two populations have distributions that might each be normally distributed.
(True/False)
4.9/5 (34)
An accounting firm has been hired by a large computer company to determine whether the proportion of accounts receivables with errors in one division (Division 1)exceeds that of the second division (Division 2).The managers believe that such a difference may exist because of the lax standards employed by the first division.The null and alternative hypotheses that will be tested are: 
(True/False)
4.9/5 (32)
Suppose that a group of 10 people join a weight loss program for 3 months.Each person's weight is recorded at the beginning and at the end of the 3-month program.To test whether the weight loss program is effective,the data should be treated as:
(Multiple Choice)
4.7/5 (36)
All other things held constant,increasing the level of confidence for a confidence interval estimate for the difference between two population means will result in a wider confidence interval estimate.
(True/False)
4.8/5 (37)
A direct retailer that sells clothing on the Internet has two distribution centers and wants to determine if there is a difference between the proportion of customer order shipments that contain errors (wrong color,wrong size,etc.).It takes a sample of orders from each distribution center and obtain the following results:  Based on these data it can proceed with assuming the normal distribution for each of the proportion sampling distributions.
(True/False)
4.8/5 (27)
The Sergio Lumber Company manufacturers plywood.One step in the process is the one where the veneer is dried by passing through a huge dryer (similar to an oven)where much of the moisture in the veneer is extracted.At the end of this step,samples of veneer are tested for moisture content.It is believed that pine veneer will be less moist on average than will fir veneer.The following data were reported recently where the values represent the percent of moisture in the wood: 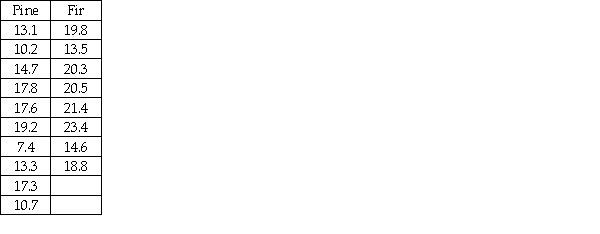 The null and alternative hypotheses to be tested are
  .
.
(True/False)
4.8/5 (17)
Filters
- Essay(0)
- Multiple Choice(0)
- Short Answer(0)
- True False(0)
- Matching(0)