Exam 12: Analysis of Variance
Exam 1: The Where, why, and How of Data Collection167 Questions
Exam 2: Graphs,charts and Tablesdescribing Your Data138 Questions
Exam 3: Describing Data Using Numerical Measures130 Questions
Exam 4: Using Probability and Probability Distributions77 Questions
Exam 5: Discrete Probability Distributions119 Questions
Exam 6: Introduction to Continuous Probability Distributions90 Questions
Exam 7: Introduction to Sampling Distributions104 Questions
Exam 8: Estimating Single Population Parameters145 Questions
Exam 9: Introduction to Hypothesis Testing129 Questions
Exam 10: Estimation and Hypothesis Testing for Two Population Parameters97 Questions
Exam 11: Hypothesis Tests and Estimation for Population Variances71 Questions
Exam 12: Analysis of Variance137 Questions
Exam 13: Goodness-Of-Fit Tests and Contingency Analysis104 Questions
Exam 14: Introduction to Linear Regression and Correlation Analysis136 Questions
Exam 15: Multiple Regression Analysis and Model Building153 Questions
Exam 16: Analyzing and Forecasting Time-Series Data133 Questions
Exam 17: Introduction to Nonparametric Statistics104 Questions
Exam 18: Introduction to Quality and Statistical Process Control110 Questions
Exam 19: Introduction to Decision Analysis116 Questions
Select questions type
The State Transportation Department is thinking of changing its speed limit signs.It is considering two new options in addition to the existing sign design.At question is whether the three sign designs will produce the same mean speed.To test this,the department has conducted a limited test in which a stretch of roadway was selected.With the original signs up,a random sample of 30 cars was selected and the speeds were measured.Then,on different days,the two new designs were installed,30 cars each day were sampled,and their speeds were recorded.Suppose that the following summary statistics were computed based on the data:  Based on these sample results and significance level equal to 0.05,the sum of squares between is:
(Multiple Choice)
4.8/5  (40)
(40)
A large orchard owner in the state of Washington is interested in determining whether the mean number of bushels of peaches per acre is the same or different depending on the type of tree that is used.He also thinks that production may be affected by the type of fertilizer that is used.To test,he has set up a test in which a one-acre plot of peach trees with a combination each of 5 varieties and 3 fertilizer types are studied.In this case,the number of treatments is:
(Multiple Choice)
4.7/5 (25)
Prior to performing a one-way analysis of variance test,the analysts were interested in determining whether the population variances were equal.The design had one factor with 3 levels and a balanced design with sample size equal to 6.Among others,the following summary statistics were computed:  = 50,
= 50,  = 80,
= 80,  = 40.Based on these statistics,the calculated F-value for performing a Hartley's F-test for equality of population variances is F = 2.00.
(True/False)
4.7/5 (41)
A fast food chain operation is interested in determining whether the mean per customer purchase differs by day of the week.To test this,it has e selected random samples of customers for each day of the week.The analysts then ran a one-way analysis of variance generating the following output: Anova: Single Factor
SUMMARY 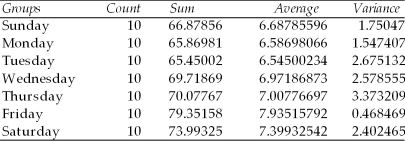 ANOVA
ANOVA 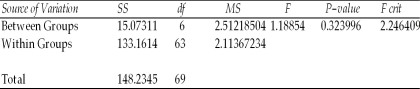 Based upon this output,which of the following statements is true if the test is conducted at the 0.05 level of significance?
(Multiple Choice)
4.9/5 (32)
If the primary null hypothesis has been rejected for a randomized complete block ANOVA designed test,the next step is to conduct a Tukey-Kramer post-comparison test to determine which shelf levels have different mean sales.
(True/False)
4.8/5 (46)
The within sample variation is the dispersion that exists because the sample means for the various factor levels are not all equal.
(True/False)
4.9/5 (38)
In a randomized complete block design analysis of variance,which of the following correctly describes the number of degrees of freedom associated with the between sum of squares?
(Multiple Choice)
4.8/5 (36)
Given the partially completed ANOVA table below,the test statistic for determining if there is any blocking effect is F = 4.38. 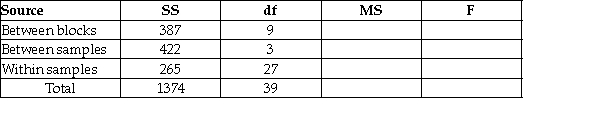
(True/False)
4.9/5 (38)
Based on the partially completed ANOVA table below,the critical value needed for testing whether there is any blocking effect is F = 8.812. 
(True/False)
4.8/5 (45)
The experiment-wide error rate will be higher than the 0.05 significance level if the multiple comparison tests for the mean difference between any two populations use the 0.05 level.
(True/False)
4.8/5 (34)
In conducting a one-way analysis of variance where the test statistic is less than the critical value,which of the following is correct?
(Multiple Choice)
4.8/5 (31)
The Tukey-Kramer method is used to test the assumption made in analysis of variance that the population variances are equal.
(True/False)
4.9/5 (24)
As a step in establishing its rates,an automobile insurance company is interested in determining whether there is a difference in the mean highway speeds that drivers of different age groups drive.To help answer this question,it has selected a random sample of drivers in three age categories: under 21,21-50,and over 50.The engineers then recorded the drivers' speeds at a designated point on a highway in the state.The subjects were unaware that their speed was being recorded.The following one-way ANOVA output was generated from the sample data.Based on this output,the engineers can conclude that the assumption of equal variances is satisfied since the calculated F-value is less than the critical F from Hartley's  table at α = .05.
Anova: Single Factor
SUMMARY
table at α = .05.
Anova: Single Factor
SUMMARY  ANOVA
ANOVA 
(True/False)
4.8/5 (39)
A study has been conducted to determine whether the mean spending for recreational activities during the month of August differs for residents of three cities.Random samples of 30 people were selected from each city and their spending on recreation was recorded during August.The following output was generated using Excel:
Anova: Single Factor
SUMMARY 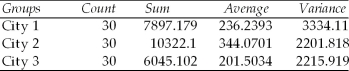 ANOVA
ANOVA 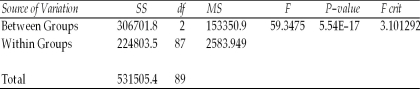 Based on the information provided,should we conclude that the three populations (cities)have equal mean spending during August? Test at the 0.05 level of significance.
(Essay)
4.8/5 (42)
A golf ball manufacturer has three dimple patterns it is interested in analyzing to see whether one results in longer driving distances.However,it also wishes to control for the material the ball is made from since it believes that the material might affect driving distance.Four materials can be used.The following data represent the results of tests in which each combination of dimple pattern and cover material were used and the length of the ball hit by a robot has been recorded.The test will be conducted using an alpha = 0.05 level. 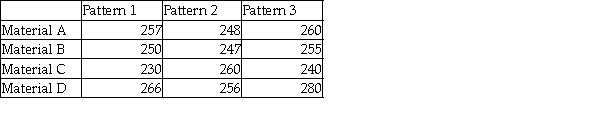 Given these data,which of the following statements is true?
(Multiple Choice)
4.8/5 (41)
In a two-factor ANOVA design with replication,if the null hypothesis pertaining to interaction between factors A and B is rejected,then it is recommended that the hypothesis tests for factor A and factor B individually should not be conducted because the conclusions might be misleading.
(True/False)
5.0/5 (31)
Which of the following is an assumption for the one-way analysis of variance experimental design?
(Multiple Choice)
5.0/5 (36)
The term one-way analysis of variance refers to the fact that in conducting the test,there is only one way to set up the null and alternative hypotheses.
(True/False)
4.7/5 (40)
As a step in establishing its rates,an automobile insurance company is interested in determining whether there is a difference in the mean highway speeds that drivers of different age groups drive.To help answer this question,it has selected a random sample of drivers in three age categories: under 21,21-50,and over 50.The engineers then recorded the drivers' speeds at a designated point on a highway in the state.The subjects were unaware that their speed was being recorded.The following one-way ANOVA output was generated from the sample data.Based upon this output,it is possible that a Type II statistical error has been committed if the null hypothesis is tested at the alpha equal 0.05 level.
Anova: Single Factor
SUMMARY 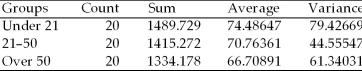 ANOVA
ANOVA 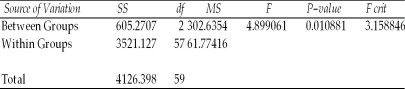
(True/False)
4.7/5 (43)
Filters
- Essay(0)
- Multiple Choice(0)
- Short Answer(0)
- True False(0)
- Matching(0)