Exam 14: Multiple Regression Analysis
Exam 1: What Is Statistics83 Questions
Exam 2: Describing Data: Frequency Tables, Frequency Distributions, and Graphic Presentation132 Questions
Exam 3: Describing Data: Numerical Measures124 Questions
Exam 4: Describing Data: Displaying and Exploring Data113 Questions
Exam 5: A Survey of Probability Concepts134 Questions
Exam 6: Discrete Probability Distributions131 Questions
Exam 7: Continuous Probability Distributions135 Questions
Exam 8: Sampling Methods and the Central Limit Theorem117 Questions
Exam 9: Estimation and Confidence Intervals131 Questions
Exam 10: One-Sample Tests of Hypothesis110 Questions
Exam 11: Two-Sample Tests of Hypothesis98 Questions
Exam 12: Analysis of Variance134 Questions
Exam 13: Correlation and Linear Regression138 Questions
Exam 14: Multiple Regression Analysis135 Questions
Exam 15: Nonparametric Methods: Nominal Level Hypothesis Tests181 Questions
Exam 16: Nonparametric Methods: Analysis of Ordinal Data138 Questions
Exam 17: Index Numbers137 Questions
Exam 18: Time Series and Forecasting139 Questions
Exam 19: Statistical Process Control and Quality Management136 Questions
Exam 20: An Introduction to Decision Theory115 Questions
Select questions type
The coefficient of determination measures the proportion of ____________.
(Multiple Choice)
4.7/5  (28)
(28)
A researcher is studying the relationship between 10 different variables and a critical measure of business performance. What method can be used to select the best set of variables to predict performance?
(Multiple Choice)
4.9/5 (30)
The best example of a null hypothesis for a global test of a multiple regression model is _________.
(Multiple Choice)
4.9/5 (33)
The multiple coefficient of determination, R2, reports the proportion of the variation in Y that is not explained by the variation in the set of independent variables.
(True/False)
4.9/5 (32)
In multiple regression analysis, how is the degree of association between a set of independent variables and a dependent variable measured?
(Multiple Choice)
4.9/5 (34)
How are residual plots drawn and used to evaluate the assumptions of linear multiple regression?
(Essay)
4.9/5 (36)
A valid multiple regression analysis assumes or requires that _________________.
(Multiple Choice)
5.0/5 (35)
A variable that can assume only one of two possible outcomes that take on the values of either 0 or 1, and is used to incorporate the effect of qualitative variables in a regression model is referred to as ________.
(Multiple Choice)
4.9/5 (34)
If a dependent variable and one of the independent variables are inversely related, the sign for the regression coefficient of the independent variable is ____________.
(Short Answer)
4.8/5 (33)
In multiple regression, the ________ is used to test the global hypothesis.
(Short Answer)
4.7/5 (38)
The production of car tires in any given year is related to the number of cars produced that year and in prior years. Suppose our econometric model resulted in the following data. 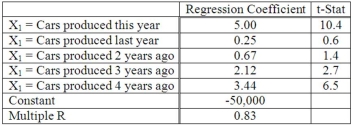 Which variable in the model is the most significant predictor of tire production?
(Essay)
4.8/5 (33)
When does multicollinearity occur in a multiple regression analysis?
(Multiple Choice)
5.0/5 (40)
In an ANOVA table, for a multiple regression analysis, the variation of the dependent variable explained by the variation of the independent variables is represented by ___________.
(Multiple Choice)
4.8/5 (40)
A manager at a local bank analyzed the relationship between monthly salary and three independent variables: length of service (measured in months), gender (0 = female, 1 = male) and job type (0 = clerical, 1 = technical). The following ANOVA summarizes the regression results: 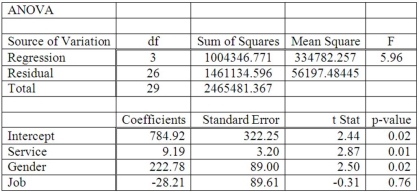 Based on the ANOVA, the multiple coefficient of determination is _________.
(Multiple Choice)
4.9/5 (35)
Twenty-one executives in a large corporation were randomly selected to study the effect of several factors on annual salary (expressed in $000s). The factors selected were age, seniority, years of college, number of company divisions they had been exposed to, and the level of their responsibility. The results of the regression analysis follow: 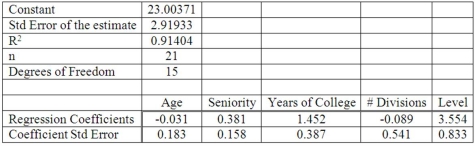 What proportion of the total variation in salary is accounted for by the set of independent variables?
(Essay)
4.9/5 (34)
A multiple regression analysis showed the following ANOVA table result. 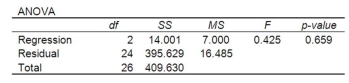 Based on the information in the ANOVA, how many independent variables were included in the multiple regression analysis?
(Essay)
4.9/5 (34)
In a regression analysis, three independent variables are used in the equation based on a sample of 40 observations. In the ANOVA table for a multiple regression analysis, what are the degrees of freedom associated with the F-statistic?
(Multiple Choice)
4.8/5 (36)
Twenty-one executives in a large corporation were randomly selected to study the effect of several factors on annual salary (expressed in $000s). The factors selected were age, seniority, years of college, number of company divisions they had been exposed to, and the level of their responsibility. The results of the regression analysis follow: 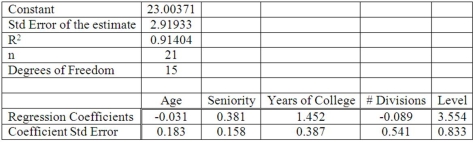
(Essay)
4.9/5 (37)
A manager at a local bank analyzed the relationship between monthly salary and three independent variables: length of service (measured in months), gender (0 = female, 1 = male) and job type (0 = clerical, 1 = technical). The following ANOVA summarizes the regression results: 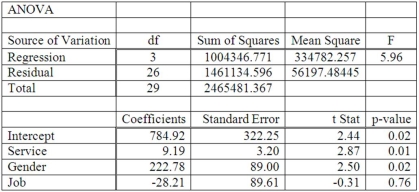 In the regression model, which of the following are dummy variables?
(Multiple Choice)
5.0/5 (34)
Filters
- Essay(0)
- Multiple Choice(0)
- Short Answer(0)
- True False(0)
- Matching(0)