Exam 15: Nonparametric Methods: Nominal Level Hypothesis Tests
Exam 1: What Is Statistics83 Questions
Exam 2: Describing Data: Frequency Tables, Frequency Distributions, and Graphic Presentation132 Questions
Exam 3: Describing Data: Numerical Measures124 Questions
Exam 4: Describing Data: Displaying and Exploring Data113 Questions
Exam 5: A Survey of Probability Concepts134 Questions
Exam 6: Discrete Probability Distributions131 Questions
Exam 7: Continuous Probability Distributions135 Questions
Exam 8: Sampling Methods and the Central Limit Theorem117 Questions
Exam 9: Estimation and Confidence Intervals131 Questions
Exam 10: One-Sample Tests of Hypothesis110 Questions
Exam 11: Two-Sample Tests of Hypothesis98 Questions
Exam 12: Analysis of Variance134 Questions
Exam 13: Correlation and Linear Regression138 Questions
Exam 14: Multiple Regression Analysis135 Questions
Exam 15: Nonparametric Methods: Nominal Level Hypothesis Tests181 Questions
Exam 16: Nonparametric Methods: Analysis of Ordinal Data138 Questions
Exam 17: Index Numbers137 Questions
Exam 18: Time Series and Forecasting139 Questions
Exam 19: Statistical Process Control and Quality Management136 Questions
Exam 20: An Introduction to Decision Theory115 Questions
Select questions type
A committee that is studying employer-employee relations proposed that each employee would rate his or her immediate supervisor, and in turn the supervisor would rate each employee. To find reactions regarding the proposal, 120 office personnel and 160 plant personnel were selected at random. Seventy-eight of the office personnel and 90 of the plant personnel were in favor of the proposal. We test the hypothesis that the population proportions are equal with a 0.05 significance level. What is our decision?
Free
(Essay)
4.9/5  (35)
(35)
Correct Answer: Verified
Fail to reject the null hypothesis
Explanation: H0: π1 = π2; H1: π1 ≠ π2. First, we find the value of the pooled proportion using 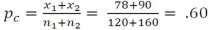 . Next, we determine the value of the test statistic using
 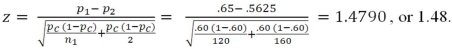 The computed value of the test statistic (+1.48) is less than the critical value of +1.96, so we fail to reject the null hypothesis.
If we wanted to see if tossing a die (a cube with the sides numbered one through six) had an equal chance of showing each side or number, what statistical test should be applied?
Free
(Short Answer)
4.8/5 (33)
Correct Answer:Verified
A chi-square goodness-of-fit test
A question has these possible responses: excellent, very good, good, fair, and unsatisfactory. What are the degrees of freedom for a goodness-of-fit test to test the hypothesis that responses are uniformly distributed?
Free
(Multiple Choice)
4.8/5 (28)
Correct Answer:Verified
C
A survey of property owners' opinions about a street-widening project was taken to determine if owners' opinions were related to the distance between their home and the street. A randomly selected sample of 100 property owners was contacted and the results are shown next. 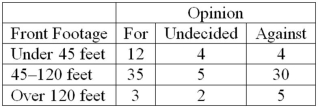 What is the expected frequency for people who are undecided about the project and have property front-footage between 45 and 120 feet?
(Multiple Choice)
4.9/5 (32)
If we are testing the difference between two population proportions, it is assumed that the two populations are approximately normal and have equal variances.
(True/False)
4.9/5 (32)
Which of the following assumptions is necessary to apply a goodness-of-fit test?
(Multiple Choice)
4.9/5 (34)
A contingency table shows the frequencies for three levels of income with gender. There are ______ degrees of freedom to test the null hypothesis that income and gender are independent.
(Short Answer)
4.9/5 (36)
Six people have declared their intentions to run for a trustee seat in the next local election. A political poll is conducted during the campaign among 1,020 randomly sampled voters to determine if there is any clear preference among the voters. The responses are shown next. 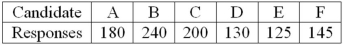 What is the expected frequency for each candidate?
(Essay)
4.8/5 (40)
Recently, students in a marketing research class were interested in the driving behavior of students. Specifically, the marketing students were interested in finding out if exceeding the speed limit was related to social activity. They collected the following responses from 100 randomly selected students: 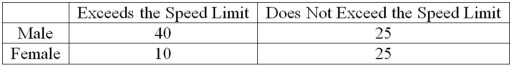 Based on the analysis, what can be concluded?
(Multiple Choice)
4.8/5 (44)
It is claimed that in a bushel of peaches, less than 10% are defective. A sample of 400 peaches is examined and 50 are found to be defective. What is the sample proportion?
(Multiple Choice)
4.7/5 (31)
Based on the Nielsen ratings, the local CBS affiliate claims its 11 p.m. newscast reaches 41% of the viewing audience in the area. In a survey of 100 viewers, 36% indicated that they watch the late evening news on this local CBS station. What is the sample proportion?
(Multiple Choice)
4.9/5 (33)
To verify that an observed frequency distribution is normally distributed, a ________ statistic is used to test the hypothesis that the sample data is normally distributed.
(Short Answer)
4.7/5 (28)
For people released from prison, the following table shows their adjustment to civilian life and place of residence. 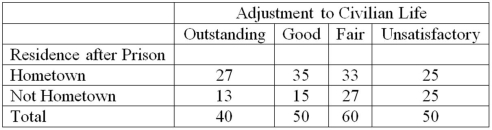 What is the critical value for this contingency table at the 0.01 level of significance?
(Multiple Choice)
4.8/5 (36)
Which of the following statements is correct regarding the chi-square distribution?
(Multiple Choice)
4.9/5 (29)
A committee that is studying employer-employee relations proposed that each employee would rate his or her immediate supervisor, and in turn the supervisor would rate each employee. To test if the reactions to the survey for office and plant personnel were the same, 120 office personnel and 160 plant personnel were selected at random. Seventy-eight of the office personnel and 90 of the plant personnel were in favor of the proposal. To test the hypothesis that the population proportions are equal, what is the critical value using the 0.05 level of significance?
(Essay)
4.8/5 (46)
We are interested in knowing if the following frequency distribution is normally distributed. The population mean and standard deviation of the data are 600 and 160, respectively. 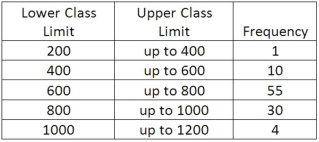 If the distribution was normally distributed, what is the probability that an observation would be a member of the "400 up to 600" class?
(Essay)
4.8/5 (24)
In a goodness-of-fit test, the null hypothesis (no difference between sets of observed and expected frequencies) is rejected when the ________________.
(Multiple Choice)
4.8/5 (37)
We are interested in knowing if the following frequency distribution is normally distributed. The population mean and standard deviation of the data are 600 and 160, respectively. 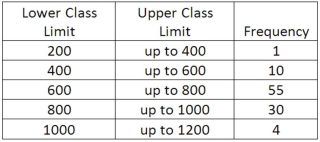 To test the hypothesis that the frequency distribution is normally distributed, the value of the chi-square test statistic is 12.19. What is the decision regarding the null hypothesis tested at the .05 level of significance?
(Essay)
4.8/5 (30)
Filters
- Essay(0)
- Multiple Choice(0)
- Short Answer(0)
- True False(0)
- Matching(0)