Exam 2: Describing Data: Frequency Tables, Frequency Distributions, and Graphic Presentation
Exam 1: What Is Statistics83 Questions
Exam 2: Describing Data: Frequency Tables, Frequency Distributions, and Graphic Presentation132 Questions
Exam 3: Describing Data: Numerical Measures124 Questions
Exam 4: Describing Data: Displaying and Exploring Data113 Questions
Exam 5: A Survey of Probability Concepts134 Questions
Exam 6: Discrete Probability Distributions131 Questions
Exam 7: Continuous Probability Distributions135 Questions
Exam 8: Sampling Methods and the Central Limit Theorem117 Questions
Exam 9: Estimation and Confidence Intervals131 Questions
Exam 10: One-Sample Tests of Hypothesis110 Questions
Exam 11: Two-Sample Tests of Hypothesis98 Questions
Exam 12: Analysis of Variance134 Questions
Exam 13: Correlation and Linear Regression138 Questions
Exam 14: Multiple Regression Analysis135 Questions
Exam 15: Nonparametric Methods: Nominal Level Hypothesis Tests181 Questions
Exam 16: Nonparametric Methods: Analysis of Ordinal Data138 Questions
Exam 17: Index Numbers137 Questions
Exam 18: Time Series and Forecasting139 Questions
Exam 19: Statistical Process Control and Quality Management136 Questions
Exam 20: An Introduction to Decision Theory115 Questions
Select questions type
A student was interested in the cigarette smoking habits of college students and collected data from an unbiased random sample of students. The data is summarized in the following table: 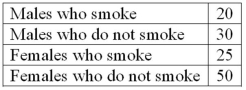 What type of chart best represents the frequency table?
Free
(Multiple Choice)
4.9/5  (38)
(38)
Correct Answer: Verified
A
Refer to the following breakdown of responses to a survey of "How confident are you that you saved enough to retire?" 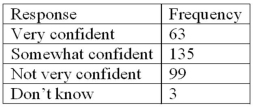 What percent of the responses indicated that users were very confident?
Free
(Multiple Choice)
4.7/5 (25)
Correct Answer:Verified
B
Refer to the following breakdown of responses to a survey of room cleanliness in a hotel. 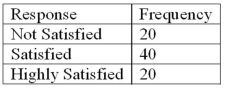 What percent of the responses indicated that customers were satisfied?
Free
(Essay)
4.8/5 (29)
Correct Answer:Verified
50%
Explanation: The satisfied class accounts for 40 of the 80 total individuals. Therefore, 40/80 (or 50%) of the customers were satisfied.
Refer to the following breakdown of responses to a survey of "Are you concerned about being tracked while connected to the Internet?"  What is the class with the greatest frequency?
(Multiple Choice)
4.8/5 (32)
In a cumulative frequency distribution, the percent of the total frequencies that would fall below the upper limit of the highest class would be _________.
(Short Answer)
4.8/5 (33)
Refer to the following information from a frequency distribution for "heights of college women" recorded to the nearest inch: the first two class midpoints are 62.5" and 65.5". What are the class limits for the lowest class?
(Multiple Choice)
4.8/5 (29)
Refer to the following breakdown of responses to a survey of "Are you concerned about being tracked while connected to the Internet?" 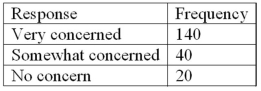 What type of chart should be used to describe the frequency table?
(Multiple Choice)
4.8/5 (33)
To convert a frequency distribution to a relative frequency distribution, divide each class frequency by the sum of the class frequencies.
(True/False)
5.0/5 (35)
In constructing a frequency distribution, the approximate class width is computed as
(Multiple Choice)
4.9/5 (31)
If the number of observations is 124, calculate the suggested number of classes using the "2 to the k rule."
(Short Answer)
4.7/5 (40)
Refer to the following breakdown of responses to a survey of "Are you concerned about being tracked while connected to the Internet?" 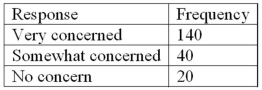 What is the class interval for the preceding frequency table?
(Multiple Choice)
4.8/5 (39)
A _____ chart is useful for displaying a frequency distribution for a nominal variable.
(Short Answer)
4.8/5 (40)
Ages (rounded to the nearest whole year) of employees at a large company were grouped into a distribution with the following class limits:
20 up to 30
30 up to 40
40 up to 50
50 up to 60
60 up to 70
What is the midpoint for the class 40 up to 50?
(Essay)
4.9/5 (37)
The following frequency distribution shows the distribution of delivery times (in days) for swimstuff.com customer orders during the last month. 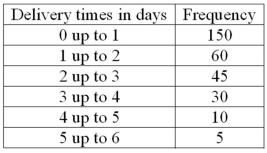 What is the relative frequency for orders delivered in less than three days?
(Essay)
4.9/5 (29)
A group of 100 students was surveyed about their interest in a new International Studies program. Interest was measured in terms of high, medium, or low. In the study, 30 students responded high interest, 40 students responded medium interest, and 30 students responded low interest. What is the relative frequency of students with high interest?
(Multiple Choice)
4.8/5 (26)
The following frequency distribution shows the distribution of delivery times (in days) for swimstuff.com customer orders during the last month. 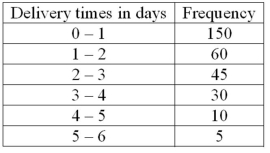 What is the relative frequency of the orders delivered from 1 day up to 3 days?
(Essay)
4.9/5 (34)
Ages (rounded to the nearest whole year) of employees at a large company were grouped into a distribution with the following class limits:
20 up to 30
30 up to 40
40 up to 50
50 up to 60
60 up to 70
The class limits for the class 50 up to 60 are _______ and ______.
(Essay)
4.9/5 (43)
The following frequency distribution shows the distribution of delivery times (in days) for swimstuff.com customer orders during the last month. 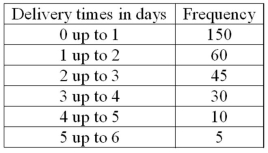 How many orders were delivered from 1 day up to 3 days?
(Essay)
4.8/5 (32)
A frequency polygon is a very useful graphic technique when comparing two or more distributions.
(True/False)
4.8/5 (37)
Filters
- Essay(0)
- Multiple Choice(0)
- Short Answer(0)
- True False(0)
- Matching(0)