Exam 4: Describing Data: Displaying and Exploring Data
Exam 1: What Is Statistics83 Questions
Exam 2: Describing Data: Frequency Tables, Frequency Distributions, and Graphic Presentation132 Questions
Exam 3: Describing Data: Numerical Measures124 Questions
Exam 4: Describing Data: Displaying and Exploring Data113 Questions
Exam 5: A Survey of Probability Concepts134 Questions
Exam 6: Discrete Probability Distributions131 Questions
Exam 7: Continuous Probability Distributions135 Questions
Exam 8: Sampling Methods and the Central Limit Theorem117 Questions
Exam 9: Estimation and Confidence Intervals131 Questions
Exam 10: One-Sample Tests of Hypothesis110 Questions
Exam 11: Two-Sample Tests of Hypothesis98 Questions
Exam 12: Analysis of Variance134 Questions
Exam 13: Correlation and Linear Regression138 Questions
Exam 14: Multiple Regression Analysis135 Questions
Exam 15: Nonparametric Methods: Nominal Level Hypothesis Tests181 Questions
Exam 16: Nonparametric Methods: Analysis of Ordinal Data138 Questions
Exam 17: Index Numbers137 Questions
Exam 18: Time Series and Forecasting139 Questions
Exam 19: Statistical Process Control and Quality Management136 Questions
Exam 20: An Introduction to Decision Theory115 Questions
Select questions type
If the mean of a distribution is smaller than the median and mode, the sign of Pearson's coefficient of skewness is ______________.
Free
(Short Answer)
4.9/5  (39)
(39)
Correct Answer: Verified
negative
A telemarketing firm is monitoring the performance of its employees based on the number of sales per hour. One employee had the following sales for the last 19 hours. 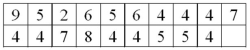 What is the third quartile for the distribution of number of sales per hour?
Free
(Essay)
4.9/5 (34)
Correct Answer:Verified
Q3 = 7 sales per hour
Explanation: Sort the data from minimum to maximum values. There are 19 values, so the third quartile is at the (19 + 1)(3/4) = 15th value in the ranked set of values, or 7.
Percentiles divide a distribution into _____________.
Free
(Multiple Choice)
4.8/5 (33)
Correct Answer:Verified
D
Draw a negatively or positively skewed distribution and show the relative locations of the mean, median, and mode.
(Essay)
4.8/5 (26)
To locate the percentile for a given observation in a data set, the data must be ___________.
(Multiple Choice)
4.8/5 (30)
Community Hospital collected data on the length of time that patients stayed in the intensive care ward. The mean time was 28 days, the median 25 days, and the modal time 23 days. The standard deviation was computed to be 4.2 days. What is Pearson's coefficient of skewness in this instance?
(Essay)
4.8/5 (38)
A ___________ is the best way to display the relationship between two variables measured on an interval or ratio level.
(Short Answer)
4.9/5 (44)
A scatter diagram is used to illustrate a relationship between gender and the preference for Coke or Pepsi.
(True/False)
4.7/5 (42)
The following stem-and-leaf display reports the number of boats shipped per week by Ottertail Boats, Inc.
11| 1 5 9
12| 0 1 2 2 6 9
13| 0 1 2 3 4 5 5 7 8 8 9
14| 2 6 8
15| 0 1 2 4 5 7 8 9
16| 1 5 7 9
How often did the company ship more than 140 boats in a week?
(Essay)
4.8/5 (39)
If the coefficient of skewness is equal to zero, the shape of the distribution is __________.
(Multiple Choice)
4.8/5 (32)
Given the sample information in the following table regarding public opinion on gun control, who is more likely to favor gun control? 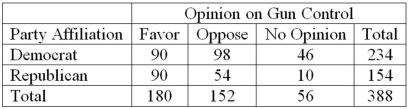
(Essay)
4.8/5 (39)
The following stem-and-leaf display reports the number of boats shipped per week by Ottertail Boats, Inc.
11| 1 5 9
12| 0 1 2 2 6 9
13| 0 1 2 3 4 5 5 7 8 8 9
14| 2 6 8
15| 0 1 2 4 5 7 8 9
16| 1 5 7 9
What are the smallest and largest values?
(Essay)
4.9/5 (43)
Filters
- Essay(0)
- Multiple Choice(0)
- Short Answer(0)
- True False(0)
- Matching(0)