Exam 14: Simple Linear Regression
Exam 1: Data and Statistics98 Questions
Exam 2: Descriptive Statistics: Tabular and Graphical Presentations64 Questions
Exam 3: Descriptive Statistics: Numerical Measures156 Questions
Exam 4: Introduction to Probability138 Questions
Exam 5: Discrete Probability Distributions122 Questions
Exam 6: Continuous Probability Distributions165 Questions
Exam 7: Sampling and Sampling Distributions131 Questions
Exam 8: Interval Estimation131 Questions
Exam 9: Hypothesis Tests133 Questions
Exam 10: Statistical Inference About Means and Proportions With Two Populations121 Questions
Exam 11: Inferences About Population Variances91 Questions
Exam 12: Tests of Goodness of Fit and Independence80 Questions
Exam 13: Analysis of Variance and Experimental Design113 Questions
Exam 14: Simple Linear Regression140 Questions
Exam 15: Multiple Regression106 Questions
Exam 16: Regression Analysis: Model Building75 Questions
Exam 17: Index Numbers52 Questions
Exam 18: Forecasting67 Questions
Exam 19: Nonparametric Methods81 Questions
Exam 20: Statistical Methods for Quality Control30 Questions
Exam 21: Decision Analysis65 Questions
Exam 22: Sample Survey63 Questions
Select questions type
Exhibit 14-5
The following information regarding a dependent variable (Y)and an independent variable (X)is provided.
 -Refer to Exhibit 14-5.The MSE is
(Multiple Choice)
4.8/5  (29)
(29)
Exhibit 14-4
Regression analysis was applied between sales data (Y in $1,000s)and advertising data (x in $100s)and the following information was obtained.
 = 12 + 1.8 x
n = 17
SSR = 225
SSE = 75
Sb1 = 0.2683
-Refer to Exhibit 14-4.Based on the above estimated regression equation,if advertising is $3,000,then the point estimate for sales (in dollars)is
= 12 + 1.8 x
n = 17
SSR = 225
SSE = 75
Sb1 = 0.2683
-Refer to Exhibit 14-4.Based on the above estimated regression equation,if advertising is $3,000,then the point estimate for sales (in dollars)is
(Multiple Choice)
4.9/5 (37)
If there is a very strong correlation between two variables then the coefficient of determination must be
(Multiple Choice)
4.8/5 (37)
Exhibit 14-2
You are given the following information about y and x.
 -Refer to Exhibit 14-2.The point estimate of y when x = 10 is
(Multiple Choice)
5.0/5 (33)
In a simple regression analysis (where Y is a dependent and X an independent variable),if the Y intercept is positive,then
(Multiple Choice)
4.8/5 (34)
Exhibit 14-2
You are given the following information about y and x.
-Refer to Exhibit 14-2.The coefficient of determination equals
(Multiple Choice)
4.9/5 (31)
If the coefficient of determination is 0.81,the coefficient of correlation
(Multiple Choice)
4.8/5 (47)
Exhibit 14-2
You are given the following information about y and x.
-Refer to Exhibit 14-2.The least squares estimate of b0 (intercept)equals
(Multiple Choice)
5.0/5 (28)
The interval estimate of an individual value of y for a given value of x is
(Multiple Choice)
5.0/5 (34)
Exhibit 14-9
A regression and correlation analysis resulted in the following information regarding a dependent variable (y)and an independent variable (x).
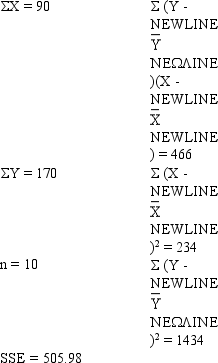 -Refer to Exhibit 14-9.The least squares estimate of b0 equals
(Multiple Choice)
4.8/5 (35)
In regression analysis,the unbiased estimate of the variance is
(Multiple Choice)
4.9/5 (34)
Part of an Excel output relating X (independent variable)and Y (dependent variable)is shown below.Fill in all the blanks marked with "?".


(Essay)
4.8/5 (31)
Assume you have noted the following prices for books and the number of pages that each book contains.
 a.Perform an F test and determine if the price and the number of pages of the books are related.Let = 0.01.
b.Perform a t test and determine if the price and the number of pages of the books are related.Let = 0.01.
c.Develop a 90% confidence interval for estimating the average price of books that contain 800 pages.
d.Develop a 90% confidence interval to estimate the price of a specific book that has 800 pages.
a.Perform an F test and determine if the price and the number of pages of the books are related.Let = 0.01.
b.Perform a t test and determine if the price and the number of pages of the books are related.Let = 0.01.
c.Develop a 90% confidence interval for estimating the average price of books that contain 800 pages.
d.Develop a 90% confidence interval to estimate the price of a specific book that has 800 pages.
(Essay)
4.8/5 (35)
Below you are given information on a woman's age and her annual expenditure on purchase of books.
 a.Develop the least squares regression equation.
b.Compute the coefficient of determination.
c.Use a t test to determine whether the slope is significantly different from zero.Let = 0.05.
d.At 95% confidence,perform an F test and determine whether or not the model is significant.
a.Develop the least squares regression equation.
b.Compute the coefficient of determination.
c.Use a t test to determine whether the slope is significantly different from zero.Let = 0.05.
d.At 95% confidence,perform an F test and determine whether or not the model is significant.
(Essay)
4.8/5 (30)
Given below are four observations collected in a regression study on two variables x (independent variable)and y (dependent variable).
 a.Develop the least squares estimated regression equation.
b.At 95% confidence,perform a t test and determine whether or not the slope is significantly different from zero.
c.Perform an F test to determine whether or not the model is significant.Let = 0.05.
d.Compute the coefficient of determination.
a.Develop the least squares estimated regression equation.
b.At 95% confidence,perform a t test and determine whether or not the slope is significantly different from zero.
c.Perform an F test to determine whether or not the model is significant.Let = 0.05.
d.Compute the coefficient of determination.
(Essay)
4.8/5 (38)
Exhibit 14-9
A regression and correlation analysis resulted in the following information regarding a dependent variable (y)and an independent variable (x).
-Refer to Exhibit 14-9.The coefficient of determination equals
(Multiple Choice)
4.9/5 (33)
Filters
- Essay(0)
- Multiple Choice(0)
- Short Answer(0)
- True False(0)
- Matching(0)