Exam 14: Simple Linear Regression
Exam 1: Data and Statistics98 Questions
Exam 2: Descriptive Statistics: Tabular and Graphical Presentations64 Questions
Exam 3: Descriptive Statistics: Numerical Measures156 Questions
Exam 4: Introduction to Probability138 Questions
Exam 5: Discrete Probability Distributions122 Questions
Exam 6: Continuous Probability Distributions165 Questions
Exam 7: Sampling and Sampling Distributions131 Questions
Exam 8: Interval Estimation131 Questions
Exam 9: Hypothesis Tests133 Questions
Exam 10: Statistical Inference About Means and Proportions With Two Populations121 Questions
Exam 11: Inferences About Population Variances91 Questions
Exam 12: Tests of Goodness of Fit and Independence80 Questions
Exam 13: Analysis of Variance and Experimental Design113 Questions
Exam 14: Simple Linear Regression140 Questions
Exam 15: Multiple Regression106 Questions
Exam 16: Regression Analysis: Model Building75 Questions
Exam 17: Index Numbers52 Questions
Exam 18: Forecasting67 Questions
Exam 19: Nonparametric Methods81 Questions
Exam 20: Statistical Methods for Quality Control30 Questions
Exam 21: Decision Analysis65 Questions
Exam 22: Sample Survey63 Questions
Select questions type
Exhibit 14-6
For the following data the value of SSE = 0.4130.
 -Refer to Exhibit 14-6.The coefficient of determination (r2)equals
(Multiple Choice)
4.9/5  (39)
(39)
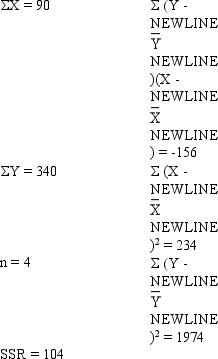
Exhibit 14-7
You are given the following information about y and x.
 -Refer to Exhibit 14-7.The coefficient of determination equals
(Multiple Choice)
4.8/5 (38)
In a regression analysis if SST = 500 and SSE = 300,then the coefficient of determination is
(Multiple Choice)
4.8/5 (38)
Assume you have noted the following prices for books and the number of pages that each book contains.
 a.Develop a least-squares estimated regression line.
b.Compute the coefficient of determination and explain its meaning.
c.Compute the correlation coefficient between the price and the number of pages.Test to see if x and y are related.Use = 0.10.
a.Develop a least-squares estimated regression line.
b.Compute the coefficient of determination and explain its meaning.
c.Compute the correlation coefficient between the price and the number of pages.Test to see if x and y are related.Use = 0.10.
(Essay)
4.9/5 (34)
If a data set has SSR = 400 and SSE = 100,then the coefficient of determination is
(Multiple Choice)
4.8/5 (33)
Exhibit 14-1
The following information regarding a dependent variable (Y)and an independent variable (X)is provided.
 SSE = 6
SST = 16
-Refer to Exhibit 14-1.The coefficient of correlation is
SSE = 6
SST = 16
-Refer to Exhibit 14-1.The coefficient of correlation is
(Multiple Choice)
4.8/5 (40)
Exhibit 14-4
Regression analysis was applied between sales data (Y in $1,000s)and advertising data (x in $100s)and the following information was obtained.
 = 12 + 1.8 x
n = 17
SSR = 225
SSE = 75
Sb1 = 0.2683
-Refer to Exhibit 14-4.The critical t value for testing the significance of the slope at 95% confidence is
= 12 + 1.8 x
n = 17
SSR = 225
SSE = 75
Sb1 = 0.2683
-Refer to Exhibit 14-4.The critical t value for testing the significance of the slope at 95% confidence is
(Multiple Choice)
4.7/5 (39)
Below you are given information on annual income and years of college education.
 a.Develop the least squares regression equation.
b.Estimate the yearly income of an individual with 6 years of college education.
c.Compute the coefficient of determination.
d.Use a t test to determine whether the slope is significantly different from zero.Let = 0.05.
e.At 95% confidence,perform an F test and determine whether or not the model is significant.
a.Develop the least squares regression equation.
b.Estimate the yearly income of an individual with 6 years of college education.
c.Compute the coefficient of determination.
d.Use a t test to determine whether the slope is significantly different from zero.Let = 0.05.
e.At 95% confidence,perform an F test and determine whether or not the model is significant.
(Essay)
4.9/5 (34)
Regression analysis was applied between sales (in $1000)and advertising (in $100)and the following regression function was obtained.
 = 500 + 4 X
Based on the above estimated regression line if advertising is $10,000,then the point estimate for sales (in dollars)is
= 500 + 4 X
Based on the above estimated regression line if advertising is $10,000,then the point estimate for sales (in dollars)is
(Multiple Choice)
4.9/5 (35)
If the coefficient of determination is equal to 1,then the coefficient of correlation
(Multiple Choice)
4.9/5 (26)
In a regression analysis if SSE = 200 and SSR = 300,then the coefficient of determination is
(Multiple Choice)
4.8/5 (40)
Part of an Excel output relating X (independent variable)and Y (dependent variable)is shown below.Fill in all the blanks marked with "?".


(Essay)
4.8/5 (39)
Exhibit 14-10
The following information regarding a dependent variable Y and an independent variable X is provided.
 -Refer to Exhibit 14-10.The Y intercept is
(Multiple Choice)
4.9/5 (36)
Regression analysis was applied between demand for a product (Y)and the price of the product (X),and the following estimated regression equation was obtained.
 = 120 - 10 X
Based on the above estimated regression equation,if price is increased by 2 units,then demand is expected to
= 120 - 10 X
Based on the above estimated regression equation,if price is increased by 2 units,then demand is expected to
(Multiple Choice)
4.9/5 (37)
Exhibit 14-8
The following information regarding a dependent variable Y and an independent variable X is provided
 -Refer to Exhibit 14-8.The mean square error (MSE)is
(Multiple Choice)
4.9/5 (36)
Below you are given a partial computer output based on a sample of 8 observations,relating an independent variable (x)and a dependent variable (y).

 a.Develop the estimated regression line.
b.At = 0.05,test for the significance of the slope.
c.At = 0.05,perform an F test.
d.Determine the coefficient of determination.
a.Develop the estimated regression line.
b.At = 0.05,test for the significance of the slope.
c.At = 0.05,perform an F test.
d.Determine the coefficient of determination.
(Essay)
4.7/5 (42)
In regression and correlation analysis,if SSE and SST are known,then with this information the
(Multiple Choice)
4.8/5 (33)
Exhibit 14-4
Regression analysis was applied between sales data (Y in $1,000s)and advertising data (x in $100s)and the following information was obtained.
= 12 + 1.8 x
n = 17
SSR = 225
SSE = 75
Sb1 = 0.2683
-Refer to Exhibit 14-4.To perform an F test,the p-value is
(Multiple Choice)
4.8/5 (31)
Filters
- Essay(0)
- Multiple Choice(0)
- Short Answer(0)
- True False(0)
- Matching(0)