Exam 14: Simple Linear Regression
Exam 1: Data and Statistics98 Questions
Exam 2: Descriptive Statistics: Tabular and Graphical Presentations64 Questions
Exam 3: Descriptive Statistics: Numerical Measures156 Questions
Exam 4: Introduction to Probability138 Questions
Exam 5: Discrete Probability Distributions122 Questions
Exam 6: Continuous Probability Distributions165 Questions
Exam 7: Sampling and Sampling Distributions131 Questions
Exam 8: Interval Estimation131 Questions
Exam 9: Hypothesis Tests133 Questions
Exam 10: Statistical Inference About Means and Proportions With Two Populations121 Questions
Exam 11: Inferences About Population Variances91 Questions
Exam 12: Tests of Goodness of Fit and Independence80 Questions
Exam 13: Analysis of Variance and Experimental Design113 Questions
Exam 14: Simple Linear Regression140 Questions
Exam 15: Multiple Regression106 Questions
Exam 16: Regression Analysis: Model Building75 Questions
Exam 17: Index Numbers52 Questions
Exam 18: Forecasting67 Questions
Exam 19: Nonparametric Methods81 Questions
Exam 20: Statistical Methods for Quality Control30 Questions
Exam 21: Decision Analysis65 Questions
Exam 22: Sample Survey63 Questions
Select questions type
Given below are five observations collected in a regression study on two variables,x (independent variable)and y (dependent variable).
 a.Develop the least squares estimated regression equation.
b.At 95% confidence,perform a t test and determine whether or not the slope is significantly different from zero.
c.Perform an F test to determine whether or not the model is significant.Let = 0.05.
d.Compute the coefficient of determination.
e.Compute the coefficient of correlation.
a.Develop the least squares estimated regression equation.
b.At 95% confidence,perform a t test and determine whether or not the slope is significantly different from zero.
c.Perform an F test to determine whether or not the model is significant.Let = 0.05.
d.Compute the coefficient of determination.
e.Compute the coefficient of correlation.
(Essay)
4.8/5  (40)
(40)
Compared to the confidence interval estimate for a particular value of y (in a linear regression model),the interval estimate for an average value of y will be
(Multiple Choice)
4.8/5 (21)
Exhibit 14-4
Regression analysis was applied between sales data (Y in $1,000s)and advertising data (x in $100s)and the following information was obtained.
 = 12 + 1.8 x
n = 17
SSR = 225
SSE = 75
Sb1 = 0.2683
-Refer to Exhibit 14-4.The t statistic for testing the significance of the slope is
= 12 + 1.8 x
n = 17
SSR = 225
SSE = 75
Sb1 = 0.2683
-Refer to Exhibit 14-4.The t statistic for testing the significance of the slope is
(Multiple Choice)
4.7/5 (36)
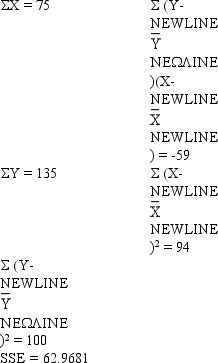
Exhibit 14-3
You are given the following information about y and x.
 -Refer to Exhibit 14-3.The coefficient of determination equals
(Multiple Choice)
4.9/5 (40)
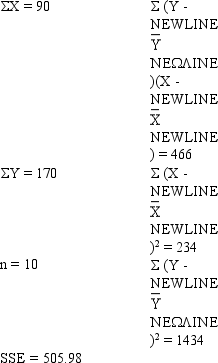
Exhibit 14-8
The following information regarding a dependent variable Y and an independent variable X is provided
 -Refer to Exhibit 14-8.The Y intercept is
(Multiple Choice)
4.9/5 (44)
If the coefficient of correlation is a negative value,then the coefficient of determination
(Multiple Choice)
4.8/5 (30)
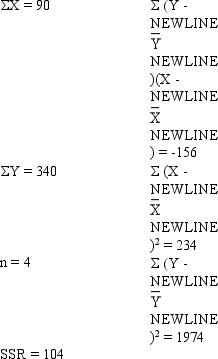
Exhibit 14-9
A regression and correlation analysis resulted in the following information regarding a dependent variable (y)and an independent variable (x).
 -Refer to Exhibit 14-9.The least squares estimate of b1 equals
(Multiple Choice)
4.9/5 (29)
Jason believes that the sales of coffee at his coffee shop depend upon the weather.He has taken a sample of 6 days.Below you are given the results of the sample.
 a.Which variable is the dependent variable?
b.Compute the least squares estimated line.
c.Compute the correlation coefficient between temperature and the sales of coffee.
d.Is there a significant relationship between the sales of coffee and temperature? Use a .05 level of significance.Be sure to state the null and alternative hypotheses.
e.Predict sales of a 90 degree day.
a.Which variable is the dependent variable?
b.Compute the least squares estimated line.
c.Compute the correlation coefficient between temperature and the sales of coffee.
d.Is there a significant relationship between the sales of coffee and temperature? Use a .05 level of significance.Be sure to state the null and alternative hypotheses.
e.Predict sales of a 90 degree day.
(Essay)
4.7/5 (30)
If the coefficient of correlation is 0.8,the percentage of variation in the dependent variable explained by the variation in the independent variable is
(Multiple Choice)
4.8/5 (37)
If the coefficient of determination is a positive value,then the coefficient of correlation
(Multiple Choice)
4.8/5 (30)
A regression analysis between sales (in $1000)and price (in dollars)resulted in the following equation
 = 60 - 8X
The above equation implies that an
= 60 - 8X
The above equation implies that an
(Multiple Choice)
4.8/5 (35)
Exhibit 14-1
The following information regarding a dependent variable (Y)and an independent variable (X)is provided.
 SSE = 6
SST = 16
-Refer to Exhibit 14-1.The least squares estimate of the slope is
SSE = 6
SST = 16
-Refer to Exhibit 14-1.The least squares estimate of the slope is
(Multiple Choice)
4.8/5 (29)
Below you are given a partial computer output based on a sample of 8 observations,relating an independent variable (x)and a dependent variable (y).

 a.Develop the estimated regression line.
b.At = 0.05,test for the significance of the slope.
c.At = 0.05,perform an F test.
d.Determine the coefficient of determination.
a.Develop the estimated regression line.
b.At = 0.05,test for the significance of the slope.
c.At = 0.05,perform an F test.
d.Determine the coefficient of determination.
(Essay)
4.9/5 (37)
Larger values of r2 imply that the observations are more closely grouped about the
(Multiple Choice)
4.8/5 (26)
Exhibit 14-1
The following information regarding a dependent variable (Y)and an independent variable (X)is provided.
SSE = 6
SST = 16
-Refer to Exhibit 14-1.The coefficient of determination is
(Multiple Choice)
4.8/5 (37)
A company has recorded data on the daily demand for its product (Y in thousands of units)and the unit price (X in hundreds of dollars).A sample of 15 days demand and associated prices resulted in the following data.
 a.Using the above information,develop the least-squares estimated regression line and write the equation.
b.Compute the coefficient of determination.
c.Perform an F test and determine whether or not there is a significant relationship between demand and unit price.Let = 0.05.
d.Would the demand ever reach zero? If yes,at what price would the demand be zero?
a.Using the above information,develop the least-squares estimated regression line and write the equation.
b.Compute the coefficient of determination.
c.Perform an F test and determine whether or not there is a significant relationship between demand and unit price.Let = 0.05.
d.Would the demand ever reach zero? If yes,at what price would the demand be zero?
(Essay)
4.9/5 (34)
Given below are five observations collected in a regression study on two variables x (independent variable)and y (dependent variable).
 a.Develop the least squares estimated regression equation
b.At 95% confidence,perform a t test and determine whether or not the slope is significantly different from zero.
c.Perform an F test to determine whether or not the model is significant.Let = 0.05.
d.Compute the coefficient of determination.
e.Compute the coefficient of correlation.
a.Develop the least squares estimated regression equation
b.At 95% confidence,perform a t test and determine whether or not the slope is significantly different from zero.
c.Perform an F test to determine whether or not the model is significant.Let = 0.05.
d.Compute the coefficient of determination.
e.Compute the coefficient of correlation.
(Essay)
4.9/5 (37)
A regression analysis between sales (Y in $1000)and advertising (X in dollars)resulted in the following equation
 = 30,000 + 4 X
The above equation implies that an
= 30,000 + 4 X
The above equation implies that an
(Multiple Choice)
4.7/5 (32)
Filters
- Essay(0)
- Multiple Choice(0)
- Short Answer(0)
- True False(0)
- Matching(0)