Exam 15: Multiple Regression
Exam 1: Data and Statistics98 Questions
Exam 2: Descriptive Statistics: Tabular and Graphical Presentations64 Questions
Exam 3: Descriptive Statistics: Numerical Measures156 Questions
Exam 4: Introduction to Probability138 Questions
Exam 5: Discrete Probability Distributions122 Questions
Exam 6: Continuous Probability Distributions165 Questions
Exam 7: Sampling and Sampling Distributions131 Questions
Exam 8: Interval Estimation131 Questions
Exam 9: Hypothesis Tests133 Questions
Exam 10: Statistical Inference About Means and Proportions With Two Populations121 Questions
Exam 11: Inferences About Population Variances91 Questions
Exam 12: Tests of Goodness of Fit and Independence80 Questions
Exam 13: Analysis of Variance and Experimental Design113 Questions
Exam 14: Simple Linear Regression140 Questions
Exam 15: Multiple Regression106 Questions
Exam 16: Regression Analysis: Model Building75 Questions
Exam 17: Index Numbers52 Questions
Exam 18: Forecasting67 Questions
Exam 19: Nonparametric Methods81 Questions
Exam 20: Statistical Methods for Quality Control30 Questions
Exam 21: Decision Analysis65 Questions
Exam 22: Sample Survey63 Questions
Select questions type
A student used multiple regression analysis to study how family spending (Y)is influenced by income (X1),family size (X2),and additions to savings (X3).The variables Y,X1,and X3 are measured in thousands of dollars.The following results were obtained.

 a.Write out the estimated regression equation for the relationship between the variables.
b.Compute R2.What can you say about the strength of this relationship?
c.Carry out a test of whether Y is significantly related to the independent variables.Use a .05 level of significance.
d.Carry out a test to see if X3 and Y are significantly related.Use a .05 level of significance.
a.Write out the estimated regression equation for the relationship between the variables.
b.Compute R2.What can you say about the strength of this relationship?
c.Carry out a test of whether Y is significantly related to the independent variables.Use a .05 level of significance.
d.Carry out a test to see if X3 and Y are significantly related.Use a .05 level of significance.
(Essay)
4.9/5  (35)
(35)
A regression model in which more than one independent variable is used to predict the dependent variable is called
(Multiple Choice)
4.9/5 (36)
Multiple regression analysis was used to study how an individual's income (Y in thousands of dollars)is influenced by age (X1 in years),level of education (X2 ranging from 1 to 5),and the person's gender (X3 where 0 =female and 1=male).The following is a partial result of a computer program that was used on a sample of 20 individuals.
 a.Compute the coefficient of determination.
b.Perform a t test and determine whether or not the coefficient of the variable "level of education" (i.e. ,X2)is significantly different from zero.Let = 0.05.
c.At = 0.05,perform an F test and determine whether or not the regression model is significant.
d.As you note the coefficient of X3 is -0.510.Fully interpret the meaning of this coefficient.
a.Compute the coefficient of determination.
b.Perform a t test and determine whether or not the coefficient of the variable "level of education" (i.e. ,X2)is significantly different from zero.Let = 0.05.
c.At = 0.05,perform an F test and determine whether or not the regression model is significant.
d.As you note the coefficient of X3 is -0.510.Fully interpret the meaning of this coefficient.
(Essay)
4.9/5 (39)
Exhibit 15-4
a. 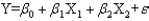 b.
b. 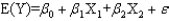 c.
c. 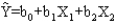 d.
d. 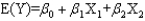 -Which equation describes the multiple regression model?
(Multiple Choice)
4.8/5 (23)
In order to test for the significance of a regression model involving 14 independent variables and 255 observations,the numerator and denominator degrees of freedom (respectively)for the critical value of F are
(Multiple Choice)
4.7/5 (35)
The following regression model has been proposed to predict sales at a computer store. 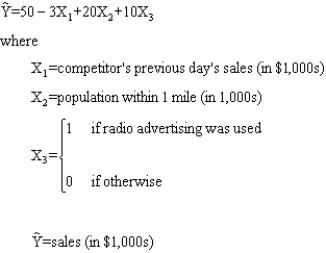 Predict sales (in dollars)for a store with the competitor's previous day's sale of $5,000,a population of 20,000 within 1 mile,and nine radio advertisements.
(Essay)
4.8/5 (34)
Exhibit 15-6
Below you are given a partial computer output based on a sample of 16 observations.
 -Refer to Exhibit 15-6.The sum of squares due to error (SSE)equals
(Multiple Choice)
4.8/5 (33)
A multiple regression model has the form  As x1 increases by 1 unit (holding x2 constant),y is expected to
(Multiple Choice)
4.8/5 (26)
Exhibit 15-2
PTS: 1 TOP: Multiple Regression
NARRBEGIN: Exhibit 15-3
Exhibit 15-3
In a regression model involving 30 observations,the following estimated regression equation was obtained: 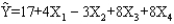 For this model SSR = 700 and SSE = 100.
-Refer to Exhibit 15-3.The critical F value at 95% confidence is
For this model SSR = 700 and SSE = 100.
-Refer to Exhibit 15-3.The critical F value at 95% confidence is
(Multiple Choice)
4.8/5 (36)
Exhibit 15-2
A regression model between sales (Y in $1,000),unit price (X1 in dollars)and television advertisement (X2 in dollars)resulted in the following function: 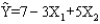 For this model SSR = 3500,SSE = 1500,and the sample size is 18.
-Refer to Exhibit 15-2.To test for the significance of the model,the p-value is
For this model SSR = 3500,SSE = 1500,and the sample size is 18.
-Refer to Exhibit 15-2.To test for the significance of the model,the p-value is
(Multiple Choice)
4.7/5 (44)
A regression analysis involved 6 independent variables and 27 observations.The critical value of t for testing the significance of each of the independent variable's coefficients will have
(Multiple Choice)
4.9/5 (42)
Exhibit 15-4
a. b. c. d.
-Which equation gives the estimated regression line?
(Multiple Choice)
4.7/5 (35)
A regression was performed on a sample of 16 observations.The estimated equation is 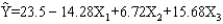 .The standard errors for the coefficients are Sb1 = 4.2,Sb2 = 5.6,and Sb3 = 2.8.For this model,SST = 3809.6 and SSR = 3285.4.
a.Compute the appropriate t ratios.
b.Test for the significance of 1, 2 and 3at the 5% level of significance.
c.Do you think that any of the variables should be dropped from the model? Explain.
d.Compute R2 and Ra2.Interpret R2.
e.Test the significance of the relationship among the variables at the 5% level of significance.
.The standard errors for the coefficients are Sb1 = 4.2,Sb2 = 5.6,and Sb3 = 2.8.For this model,SST = 3809.6 and SSR = 3285.4.
a.Compute the appropriate t ratios.
b.Test for the significance of 1, 2 and 3at the 5% level of significance.
c.Do you think that any of the variables should be dropped from the model? Explain.
d.Compute R2 and Ra2.Interpret R2.
e.Test the significance of the relationship among the variables at the 5% level of significance.
(Essay)
4.9/5 (40)
Below you are given a partial computer output based on a sample of 12 observations relating the number of personal computers sold by a computer shop per month (Y),unit price (X1 in $1,000)and the number of advertising spots (X2)they used on a local television station.
 a.At = 0.05 level of significance,test to determine if the model is significant.That is,determine if there exists a significant relationship between the independent variables and the dependent variable.
b.Determine the multiple coefficient of determination.
c.Determine the adjusted multiple coefficient of determination.
a.At = 0.05 level of significance,test to determine if the model is significant.That is,determine if there exists a significant relationship between the independent variables and the dependent variable.
b.Determine the multiple coefficient of determination.
c.Determine the adjusted multiple coefficient of determination.
(Essay)
4.9/5 (30)
A term used to describe the case when the independent variables in a multiple regression model are correlated is
(Multiple Choice)
4.7/5 (38)
Exhibit 15-8
The following estimated regression model was developed relating yearly income (Y in $1,000s)of 30 individuals with their age (X1)and their gender (X2)(0 if male and 1 if female).  Also provided are SST = 1,200 and SSE = 384.
-Refer to Exhibit 15-8.The yearly income of a 24-year-old male individual is
Also provided are SST = 1,200 and SSE = 384.
-Refer to Exhibit 15-8.The yearly income of a 24-year-old male individual is
(Multiple Choice)
5.0/5 (39)
Below you are given a computer output based on a sample of 30 days of the price of a company's stock (Y in dollars),the Dow Jones industrial average (X1),and the stock price of the company's major competitor (X2 in dollars).
 a.Use the output shown above and write an equation that can be used to predict the price of the stock.
b.If the Dow Jones Industrial Average is 10,000 and the price of the competitor is $50,what would you expect the price of the stock to be?
c.At = 0.05,test to determine if the Dow Jones average is a significant variable.
d.At = 0.05,test to determine if the stock price of the major competitor is a significant variable.
a.Use the output shown above and write an equation that can be used to predict the price of the stock.
b.If the Dow Jones Industrial Average is 10,000 and the price of the competitor is $50,what would you expect the price of the stock to be?
c.At = 0.05,test to determine if the Dow Jones average is a significant variable.
d.At = 0.05,test to determine if the stock price of the major competitor is a significant variable.
(Essay)
4.7/5 (30)
In a situation where the dependent variable can assume only one of the two possible discrete values,
(Multiple Choice)
4.8/5 (30)
Exhibit 15-7
A regression model involving 4 independent variables and a sample of 15 periods resulted in the following sum of squares.
 -Refer to Exhibit 15-7.The test statistic from the information provided is
(Multiple Choice)
4.9/5 (32)
Filters
- Essay(0)
- Multiple Choice(0)
- Short Answer(0)
- True False(0)
- Matching(0)