Exam 15: Multiple Regression
Exam 1: Data and Statistics98 Questions
Exam 2: Descriptive Statistics: Tabular and Graphical Presentations64 Questions
Exam 3: Descriptive Statistics: Numerical Measures156 Questions
Exam 4: Introduction to Probability138 Questions
Exam 5: Discrete Probability Distributions122 Questions
Exam 6: Continuous Probability Distributions165 Questions
Exam 7: Sampling and Sampling Distributions131 Questions
Exam 8: Interval Estimation131 Questions
Exam 9: Hypothesis Tests133 Questions
Exam 10: Statistical Inference About Means and Proportions With Two Populations121 Questions
Exam 11: Inferences About Population Variances91 Questions
Exam 12: Tests of Goodness of Fit and Independence80 Questions
Exam 13: Analysis of Variance and Experimental Design113 Questions
Exam 14: Simple Linear Regression140 Questions
Exam 15: Multiple Regression106 Questions
Exam 16: Regression Analysis: Model Building75 Questions
Exam 17: Index Numbers52 Questions
Exam 18: Forecasting67 Questions
Exam 19: Nonparametric Methods81 Questions
Exam 20: Statistical Methods for Quality Control30 Questions
Exam 21: Decision Analysis65 Questions
Exam 22: Sample Survey63 Questions
Select questions type
The following results were obtained from a multiple regression analysis.
 a.How many independent variables were involved in this model?
b.How many observations were involved?
c.Determine the F statistic.
a.How many independent variables were involved in this model?
b.How many observations were involved?
c.Determine the F statistic.
(Essay)
4.9/5  (39)
(39)
Exhibit 15-6
Below you are given a partial computer output based on a sample of 16 observations.
 -Refer to Exhibit 15-6.We want to test whether the parameter 1 is significant.The test statistic equals
(Multiple Choice)
4.9/5 (34)
A regression analysis involved 8 independent variables and 99 observations.The critical value of t for testing the significance of each of the independent variable's coefficients will have
(Multiple Choice)
4.8/5 (36)
Sherri Cola Company has developed a regression model relating its sales (Y in $10,000s)with four independent variables.The four independent variables are price per unit (PRICE,in dollars),competitor's price (COMPRICE,in dollars),advertising (ADV,in $1,000s)and type of container used (CONTAIN;1 = Cans and 0 = Bottles).Part of the regression results is shown below.(Assume n = 25)
 a.If the manufacturer uses can containers,his price is $1.25,advertising $200,000,and his competitor's price is $1.50,what is your estimate of his sales? Give your answer in dollars.
b.Test to see if there is a significant relationship between sales and unit price.Let = 0.05.
c.Test to see if there is a significant relationship between sales and advertising.Let = 0.05.
d.Is the type of container a significant variable? Let = 0.05.
e.Test to see if there is a significant relationship between sales and competitor's price.Let = 0.05.
a.If the manufacturer uses can containers,his price is $1.25,advertising $200,000,and his competitor's price is $1.50,what is your estimate of his sales? Give your answer in dollars.
b.Test to see if there is a significant relationship between sales and unit price.Let = 0.05.
c.Test to see if there is a significant relationship between sales and advertising.Let = 0.05.
d.Is the type of container a significant variable? Let = 0.05.
e.Test to see if there is a significant relationship between sales and competitor's price.Let = 0.05.
(Essay)
4.9/5 (36)
In a multiple regression analysis involving 5 independent variables and 30 observations,SSR = 360 and SSE = 40.The coefficient of determination is
(Multiple Choice)
4.8/5 (33)
Exhibit 15-2
A regression model between sales (Y in $1,000),unit price (X1 in dollars)and television advertisement (X2 in dollars)resulted in the following function: 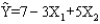 For this model SSR = 3500,SSE = 1500,and the sample size is 18.
-Refer to Exhibit 15-2.The coefficient of X2 indicates that if television advertising is increased by $1 (holding the unit price constant),sales are expected to
For this model SSR = 3500,SSE = 1500,and the sample size is 18.
-Refer to Exhibit 15-2.The coefficient of X2 indicates that if television advertising is increased by $1 (holding the unit price constant),sales are expected to
(Multiple Choice)
4.8/5 (31)
In a multiple regression model,the error term is assumed to
(Multiple Choice)
4.9/5 (33)
Exhibit 15-2
PTS: 1 TOP: Multiple Regression
NARRBEGIN: Exhibit 15-3
Exhibit 15-3
In a regression model involving 30 observations,the following estimated regression equation was obtained: 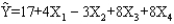 For this model SSR = 700 and SSE = 100.
-Refer to Exhibit 15-3.The computed F statistic for testing the significance of the above model is
For this model SSR = 700 and SSE = 100.
-Refer to Exhibit 15-3.The computed F statistic for testing the significance of the above model is
(Multiple Choice)
4.9/5 (31)
For a multiple regression model,SST = 200 and SSE = 50.The multiple coefficient of determination is
(Multiple Choice)
4.9/5 (29)
In order to test for the significance of a regression model involving 8 independent variables and 121 observations,the numerator and denominator degrees of freedom (respectively)for the critical value of F are
(Multiple Choice)
4.9/5 (39)
Exhibit 15-1
In a regression model involving 44 observations,the following estimated regression equation was obtained. 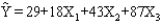 For this model SSR = 600 and SSE = 400.
-Refer to Exhibit 15-1.MSR for this model is
For this model SSR = 600 and SSE = 400.
-Refer to Exhibit 15-1.MSR for this model is
(Multiple Choice)
4.9/5 (37)
Exhibit 15-6
Below you are given a partial computer output based on a sample of 16 observations.
-Refer to Exhibit 15-6.The degrees of freedom for the sum of squares explained by the regression (SSR)are
(Multiple Choice)
4.7/5 (27)
Exhibit 15-8
The following estimated regression model was developed relating yearly income (Y in $1,000s)of 30 individuals with their age (X1)and their gender (X2)(0 if male and 1 if female). 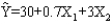 Also provided are SST = 1,200 and SSE = 384.
-Refer to Exhibit 15-8.If we want to test for the significance of the model,the critical value of F at 95% confidence is
Also provided are SST = 1,200 and SSE = 384.
-Refer to Exhibit 15-8.If we want to test for the significance of the model,the critical value of F at 95% confidence is
(Multiple Choice)
4.8/5 (33)
In multiple regression analysis,the correlation among the independent variables is termed
(Multiple Choice)
4.8/5 (25)
Exhibit 15-5
Below you are given a partial Minitab output based on a sample of 25 observations.
 -Refer to Exhibit 15-5.Carry out the test of significance for the parameter 1at the 5% level.The null hypothesis should be
(Multiple Choice)
4.8/5 (33)
For a multiple regression model,SSR = 600 and SSE = 200.The multiple coefficient of determination is
(Multiple Choice)
4.8/5 (27)
In order to test for the significance of a regression model involving 3 independent variables and 47 observations,the numerator and denominator degrees of freedom (respectively)for the critical value of F are
(Multiple Choice)
4.8/5 (27)
Exhibit 15-6
Below you are given a partial computer output based on a sample of 16 observations.
-Refer to Exhibit 15-6.Carry out the test of significance for the parameter 1 at the 1% level.The null hypothesis should be
(Multiple Choice)
4.8/5 (37)
A measure of goodness of fit for the estimated regression equation is the
(Multiple Choice)
4.8/5 (34)
Filters
- Essay(0)
- Multiple Choice(0)
- Short Answer(0)
- True False(0)
- Matching(0)