Exam 11: Hypothesis Tests Involving Two Sample Means
Exam 1: A Preview of Business Statistics55 Questions
Exam 2: Visual Description of Data67 Questions
Exam 3: Statistical Description of Data146 Questions
Exam 4: Data Collection and Sampling Methods104 Questions
Exam 5: Probability: Review of Basic Concepts188 Questions
Exam 6: Discrete Probability Distributions140 Questions
Exam 7: Continuous Probability Distributions160 Questions
Exam 8: Sampling Distributions108 Questions
Exam 9: Estimation From Sample Data150 Questions
Exam 10: Hypothesis Tests Involving a Sample Mean or Proportion170 Questions
Exam 11: Hypothesis Tests Involving Two Sample Means149 Questions
Exam 12: Analysis of Variance Tests173 Questions
Exam 13: Chi-Square Applications134 Questions
Exam 14: Nonparametric Methods139 Questions
Exam 15: Simple Linear Regression and Correlation145 Questions
Exam 16: Multiple Regression and Correlation98 Questions
Exam 17: Model Building83 Questions
Exam 18: Models for Time Series and Forecasting127 Questions
Exam 19: Decision Theory82 Questions
Exam 20: Total Quality Management132 Questions
Select questions type
Fast Food
The general manager of a chain of fast food chicken restaurants wants to determine how effective their promotional campaigns are.In these campaigns "20% off" coupons are widely distributed.These coupons are only valid for one week.To examine their effectiveness,the executive records the daily gross sales (in $1,000s)in one restaurant during the campaign and during the week after the campaign ends.The data is shown below. Day Sales During Campaign Sales After Campaign Sunday 18.1 16.6 Monday 10.0 8.8 Tuesday 9.1 8.6 Wednesday 8.4 8.3 Thursday 10.8 10.1 Friday 13.1 12.3 Saturday 20.8 18.9
-Briefly explain what the 95% interval estimate tells you.
(Essay)
4.8/5  (36)
(36)
Textbook
A large textbook publisher is concerned about the sale of complimentary desk copies of textbooks to wholesale book buyers.The publisher randomly samples the faculty from two universities,A and B.Information provided by salespeople suggests that the faculty at University A had copies of the publisher's books that had been shipped,whereas the faculty at University B seldomly had them.Let be the proportion of faculty at University A who sell this publisher's books and be the proportion of faculty at University B who sell this publisher's books.The samples provide these data: 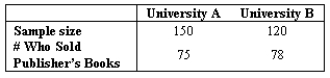 At the 0.05 significance level,is this publisher reasonably justified in saying there is a higher proportion of faculty at University B who sell this publisher's complimentary books than at University A?
-State the conclusion.
At the 0.05 significance level,is this publisher reasonably justified in saying there is a higher proportion of faculty at University B who sell this publisher's complimentary books than at University A?
-State the conclusion.
(Essay)
4.8/5 (34)
If we wish to examine the before-and-after productivity of individual employees after a change in their workstation layout,a matched-pairs t-test is applicable.
(True/False)
4.8/5 (30)
Ford Motor Co.
The Ford Motor Company,as part of its quality control program,began returning to the supplier all shipments of steel that had defects or faulty chemistry.When Ford began this program,the defective rate in 100 shipments was 9%.A recent survey indicated that 2.2% in 136 shipments was defective.Does this represent a significant improvement in the quality of the steel? Test at the 0.05 level.
-What is the test statistic?
Appropriate test: ____________________
Test statistic = ______________________
(Short Answer)
5.0/5 (24)
In testing the difference between two population means using two independent samples,we use the pooled variance in estimating the standard error of the sampling distribution of the sample mean difference if the:
(Multiple Choice)
4.9/5 (42)
Automotive parts
A regional automotive parts chain store firm wants to improve the sales of tune-up supplies.It believes that a TV ad with a popular local,but offbeat,know-it-all actor might be able to affect their sales.Before the ads are run on TV,the company randomly samples eight of its weekly sales from past years.Following the ad campaign,eight weeks of sales were sampled.Weekly sales are approximately normally distributed and the population standard deviations are equal.Their hypothesis test is: Did the TV ad campaign help or hurt sales? To answer this question,the company plans to use a 0.05 significance level.The results of the two samples are: Before Ad Campaign After Ad Campaign =8 =8 =184 =189 =548 =456
-State null and alternative hypotheses.
H0: ____________________
H1: ____________________
(Short Answer)
4.8/5 (33)
The A-1 Video Rental has run two specials in the local newspaper.One was a two-for-one rental for Tuesday through Thursday.The second was for $1 off on Friday and Saturday.A computer output is shown below: n MEAN STDEV SEMEAN Tues-Thur 15 185.5 28.2 7.3 Fri-Sat 13 268.2 30.6 8.5 Determine at the 0.05 level if the standard deviations of the populations are equal.
Test statistic = ____________________
Conclusion: ____________________
(Essay)
4.9/5 (29)
Price earnings
A comparison of the price-earnings (P/E)ratio for the top and bottom 100 companies in valuation is being prepared.A financial advisor randomly sampled each group to determine whether there is any difference in P/E ratios of the two groups of companies.Let 1 = a top 100 company and 2 = a bottom 100 company.Assume equal population variances and that the populations are normally distributed.The advisor is to use a 0.01 significance level.The data were randomly selected and are summarized below: Top 100 company Bottom 100 company =6 =6 =18.83 =10.67 =128.17 =8.67
-What is the decision rule?
(Essay)
4.8/5 (40)
Shooting club
A trap and skeet shooting club purchases clay pigeons.These are quite fragile and often break in the box during shipment without any outward sign of breakage.Even as the pigeons are loaded into the throwing machine,broken or cracked pigeons may not be noticed.Each pigeon broken is a net loss to the club so the club is anxious to purchase from suppliers who have a record of little or no breakage in shipping and handling.Two suppliers of clay pigeons are contacted and asked for price quotes.Supplier 1 quotes a higher price than Supplier 2 but says that the higher price is the result of better packaging and thus more usable pigeons per case.The shooting club manager decides to purchase 10 cases from both suppliers.Each case has 250 pigeons.Careful records are maintained on each case as to the number of good pigeons.The records after the cases were used are as follows: Number of good pigeons Supplier 1 Supplier 2 234 222 237 225 240 219 241 221 234 218 235 226 241 230 246 219 240 208 243 213
-Use Excel or Minitab to summarize this data using descriptive statistics
(Essay)
4.8/5 (36)
National Management Assoc
The National Management Association reports that during the past year,there has been a substantial increase in the use of "flextime" in the work place.Last year,a sample of 100 businesses was taken which indicated that 22% had implemented the use of "flextime." This year,a second survey of 100 showed that 29% were using flextime.At the 0.05 level,does this represent an increase in the proportion?
-State the decision rule.
(Essay)
4.9/5 (30)
Medicare
An economist wishes to test whether there is any difference in the proportion of households receiving Medicare for white households with less than $5,000 income per year and white households with $15,000 or more income per year.A random sample from households with less than $5,000 income per year is taken,and a random sample of households with $15,000 or more income is taken.The results of the samples are: Less than \ or more Sample size 200 150 Medicare Recipients 157 139
Use a 0.01 significance level to determine if there is sufficient evidence to conclude that a difference in proportions exists.Calculate the standard error of estimate.
(Short Answer)
4.8/5 (42)
When the necessary conditions are met,a two-tail test is being conducted to test the difference between two population means,but your statistical software provides only a one-tail area of 0.036 as part of its output.The p-value for this two-tail test will be:
(Multiple Choice)
4.8/5 (31)
The z-test requires no assumptions about the shape of the population distributions as long as both n1 and n2 are ? 30.
(True/False)
5.0/5 (32)
Population
In an effort to test the hypothesis that the proportion of home ownership in the state of Delaware is different than the national proportion,the following data was collected.
Population Number of Home Owners Sample Size Delaware 310 500 Nation 390 600
-Use = 0.01.State your conclusions in terms of the p-value.
(Essay)
4.9/5 (35)
VCR's
An advertising executive suspects that there is a higher proportion of households which own VCR's residing in places with cable systems than there are for households residing in places without cable systems.The basis of this suspicion is the broader offering of premium programming available for taping in places with a cable system.The executive commissions a survey,which results in random samples of 165 households located in a cable system and 150 households,located outside any cable system.Of the households in the cable system,54 own VCR's; outside the cable system,33 households own VCR's.Let be the proportion of households owning a VCR in a cable system and be the proportion of households owning a VCR,but not in a cable system.The executive chooses 0.05 as the significance level.Can the executive reasonably conclude that the ownership of VCR's is higher in cable systems?
-Find the value of the test statistic.
Appropriate test: ____________________
Test statistic = ____________________
(Short Answer)
4.9/5 (36)
Ford Motor Co.
The Ford Motor Company,as part of its quality control program,began returning to the supplier all shipments of steel that had defects or faulty chemistry.When Ford began this program,the defective rate in 100 shipments was 9%.A recent survey indicated that 2.2% in 136 shipments was defective.Does this represent a significant improvement in the quality of the steel? Test at the 0.05 level.
What is the p-value?
(Short Answer)
4.7/5 (34)
Automotive parts
A regional automotive parts chain store firm wants to improve the sales of tune-up supplies.It believes that a TV ad with a popular local,but offbeat,know-it-all actor might be able to affect their sales.Before the ads are run on TV,the company randomly samples eight of its weekly sales from past years.Following the ad campaign,eight weeks of sales were sampled.Weekly sales are approximately normally distributed and the population standard deviations are equal.Their hypothesis test is: Did the TV ad campaign help or hurt sales? To answer this question,the company plans to use a 0.05 significance level.The results of the two samples are: Before Ad Campaign After Ad Campaign =8 =8 =184 =189 =548 =456
-What is the conclusion?
(Short Answer)
4.9/5 (36)
Population
In an effort to test the hypothesis that the proportion of home ownership in the state of Delaware is different than the national proportion,the following data was collected.
Population Number of Home Owners Sample Size Delaware 310 500 Nation 390 600
-State the null and alternative hypotheses.
(Essay)
4.9/5 (37)
National Management Assoc
The National Management Association reports that during the past year,there has been a substantial increase in the use of "flextime" in the work place.Last year,a sample of 100 businesses was taken which indicated that 22% had implemented the use of "flextime." This year,a second survey of 100 showed that 29% were using flextime.At the 0.05 level,does this represent an increase in the proportion?
-State the null and alternative hypotheses.
H0: ____________________
H1: ____________________
(Essay)
4.7/5 (44)
Financial analyst
A financial analyst is to estimate the difference in the average return-on-equity for two industry groups,bank and bank holding companies and nonblank financial companies.The sample data obtained: Bank Nonblank =32 =31 =13.10 =9.90 =23.80 =102.57
-If a 98% confidence interval for the true difference in means is (-1.49,7.89)what can you conclude about a hypothesis test for H0: at the 0.02 level?
(Essay)
4.8/5 (34)
Filters
- Essay(0)
- Multiple Choice(0)
- Short Answer(0)
- True False(0)
- Matching(0)