Exam 11: Hypothesis Tests Involving Two Sample Means
Exam 1: A Preview of Business Statistics55 Questions
Exam 2: Visual Description of Data67 Questions
Exam 3: Statistical Description of Data146 Questions
Exam 4: Data Collection and Sampling Methods104 Questions
Exam 5: Probability: Review of Basic Concepts188 Questions
Exam 6: Discrete Probability Distributions140 Questions
Exam 7: Continuous Probability Distributions160 Questions
Exam 8: Sampling Distributions108 Questions
Exam 9: Estimation From Sample Data150 Questions
Exam 10: Hypothesis Tests Involving a Sample Mean or Proportion170 Questions
Exam 11: Hypothesis Tests Involving Two Sample Means149 Questions
Exam 12: Analysis of Variance Tests173 Questions
Exam 13: Chi-Square Applications134 Questions
Exam 14: Nonparametric Methods139 Questions
Exam 15: Simple Linear Regression and Correlation145 Questions
Exam 16: Multiple Regression and Correlation98 Questions
Exam 17: Model Building83 Questions
Exam 18: Models for Time Series and Forecasting127 Questions
Exam 19: Decision Theory82 Questions
Exam 20: Total Quality Management132 Questions
Select questions type
We say samples are ____________________ when the selection process for one is related to the selection process for the other.
(Short Answer)
4.8/5  (40)
(40)
Smoking
In an effort to test the hypothesis that the proportion of males who smoke cigarettes regularly is greater than the proportion of females who smoke cigarettes regularly,the following data was collected.
Mopulation Number Wha Smoke Sample Sire Male Female 180 775
-Use = 0.05.State the decision rule in terms of the critical value.
(Essay)
4.8/5 (41)
Golf ball
A new golf ball has been designed to improve driving distance off the tee when compared to their market competitor.To test their new ball,nine golfers hit a drive with the current ball and then hit another drive with the new ball.The distance in yards for each golfer is shown in the following table.
Current Golf Ball (Pupulation 1) New Golf Ball (Population 2) 212 215 236 228 250 256 243 264 250 248 235 255 230 239 225 218 220 239
-Use = 0.05.State the decision rule in terms of the critical value.
(Short Answer)
4.8/5 (35)
Weight loss
A new diet program claims that clients will lose weight after 7 days on the program.To validate their claim,they recorded the starting and ending weight of 11 individuals over a 7-day period.The results are shown in the following table.
Starting Waight Ending Weight 221 218 215 210 206 204 236 241 214 212 256 250 240 245 222 218 239 230 218 215 229 220
-Use = 0.05.State your conclusions.
(Essay)
4.8/5 (40)
Coffee breaks
Do government employees take longer coffee breaks than private sector workers? That is a question that interested a management consultant. To examine the issue, he took a random sample of ten government employees and another random sample of ten private sector workers and measured the amount of time (in minutes) they spent in coffee breaks during the day. The results are listed below. Assume that the two populations are normally distributed.
-Explain what the interval estimate tells you.
(Essay)
4.7/5 (39)
Automotive parts
A regional automotive parts chain store firm wants to improve the sales of tune-up supplies.It believes that a TV ad with a popular local,but offbeat,know-it-all actor might be able to affect their sales.Before the ads are run on TV,the company randomly samples eight of its weekly sales from past years.Following the ad campaign,eight weeks of sales were sampled.Weekly sales are approximately normally distributed and the population standard deviations are equal.Their hypothesis test is: Did the TV ad campaign help or hurt sales? To answer this question,the company plans to use a 0.05 significance level.The results of the two samples are: Before Ad Campaign After Ad Campaign =8 =8 =184 =189 =548 =456
-What is the test statistic?
Appropriate test: ____________________
Test statistic = ____________________
(Short Answer)
4.8/5 (32)
Women drivers
In the past,young women drivers have maintained a better driving record than young men drivers.An insurance company is concerned with the driving record of its insured customers.Specifically,it conducts a test for the number of speeding tickets received during the past year by drivers between the ages of 18 and 25. Men Women =120 =85 =1.2 =0.4 =24.8 =10.6
-A test for the equality of average number of tickets per driver for the two groups is desired.Use = 0.01.What is the conclusion?
(Short Answer)
4.7/5 (40)
When comparing the mean of two dependent samples,we are interested in only one variable: the difference between measurements for each person or object.
(True/False)
4.7/5 (41)
Each of 25 consumers is provided with a package containing two different brands of instant coffee.A week later,they are asked to rate the taste of each coffee on a scale of 1 (poor taste)to 10 (excellent taste).Is this an example of independent samples or dependent samples? Explain.
(Essay)
4.8/5 (28)
When the population standard deviations are unknown and not assumed to be equal,pooling the sample standard deviations into a single estimate of their common population value is no longer applicable.
(True/False)
4.8/5 (34)
Textbook
A large textbook publisher is concerned about the sale of complimentary desk copies of textbooks to wholesale book buyers.The publisher randomly samples the faculty from two universities,A and B.Information provided by salespeople suggests that the faculty at University A had copies of the publisher's books that had been shipped,whereas the faculty at University B seldomly had them.Let be the proportion of faculty at University A who sell this publisher's books and be the proportion of faculty at University B who sell this publisher's books.The samples provide these data: 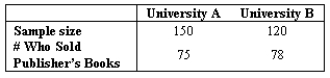 At the 0.05 significance level,is this publisher reasonably justified in saying there is a higher proportion of faculty at University B who sell this publisher's complimentary books than at University A?
-State the null and alternative hypotheses.
H0: ____________________
H1: ____________________
At the 0.05 significance level,is this publisher reasonably justified in saying there is a higher proportion of faculty at University B who sell this publisher's complimentary books than at University A?
-State the null and alternative hypotheses.
H0: ____________________
H1: ____________________
(Essay)
4.9/5 (30)
Price earnings
A comparison of the price-earnings (P/E)ratio for the top and bottom 100 companies in valuation is being prepared.A financial advisor randomly sampled each group to determine whether there is any difference in P/E ratios of the two groups of companies.Let 1 = a top 100 company and 2 = a bottom 100 company.Assume equal population variances and that the populations are normally distributed.The advisor is to use a 0.01 significance level.The data were randomly selected and are summarized below: Top 100 company Bottom 100 company =6 =6 =18.83 =10.67 =128.17 =8.67
-What is the value of the test statistic?
Appropriate test: ____________________
Test statistic = ____________________
(Short Answer)
4.8/5 (36)
Portfolio
An analyst is looking at two portfolios of common stocks in terms of the average price-earnings ratio.He wishes to determine if there is a difference between the two portfolios. Portfolio 1 Portfolio 2 =53 =50 =16.60 =17.62 =62.74 =127.95
-State the null and alternative hypotheses.
H0: ____________________
H1: ____________________
(Short Answer)
4.8/5 (29)
Production Line
A quality control inspector keeps a tally sheet of the number of acceptable and unacceptable products that come off two different production lines.The completed sheet is shown below. Products Production line Acceptable Unacceptable 1 152 48 2 136 54
-Estimate with 95% confidence the difference in population proportions.
(Short Answer)
4.9/5 (39)
Marketing research
A marketing research firm is conducting a survey to determine if there is a difference in consumer choice in the selection of two rival soft drinks.Those surveyed were asked to rank the taste from 1-10 with 10 being the highest rating.A summary of the survey follows: Real Cola New Pep =30 =36 =7.5 =5.4 =10.6 =14.9
State the null and alternative hypotheses.
H0: ____________________
H1: ____________________
(Essay)
5.0/5 (29)
Politician
In an effort to test the hypothesis that the proportion of voters in the younger than 40 year old age bracket who will vote for a particular politician is different than the proportion voters in the above 40 age bracket,the following data was collected.
Papulation Number Wha Will Vate far Palitician Sample Size Below 40 348 700 Above 40 290 650
-State the null and alternative hypotheses.
Use = 0.10.State the decision rule in terms of the critical value.
(Essay)
4.9/5 (42)
Real pop
A marketing research firm is conducting a survey to determine if there is a difference in consumer choice in the selection of two rival soft drinks.Those surveyed were asked to rank the taste from 1-10 with 10 being the highest rating.A summary of the survey follows: Real Cola New Pep =30 =36 =7.5 =5.4 =10.6 =14.9
-State the decision rule for 0.05 level of significance.
(Essay)
4.9/5 (33)
Price earnings
A comparison of the price-earnings (P/E)ratio for the top and bottom 100 companies in valuation is being prepared.A financial advisor randomly sampled each group to determine whether there is any difference in P/E ratios of the two groups of companies.Let 1 = a top 100 company and 2 = a bottom 100 company.Assume equal population variances and that the populations are normally distributed.The advisor is to use a 0.01 significance level.The data were randomly selected and are summarized below: Top 100 company Bottom 100 company =6 =6 =18.83 =10.67 =128.17 =8.67
-What is the conclusion?
(Short Answer)
4.8/5 (29)
VCR's
An advertising executive suspects that there is a higher proportion of households which own VCR's residing in places with cable systems than there are for households residing in places without cable systems.The basis of this suspicion is the broader offering of premium programming available for taping in places with a cable system.The executive commissions a survey,which results in random samples of 165 households located in a cable system and 150 households,located outside any cable system.Of the households in the cable system,54 own VCR's; outside the cable system,33 households own VCR's.Let be the proportion of households owning a VCR in a cable system and be the proportion of households owning a VCR,but not in a cable system.The executive chooses 0.05 as the significance level.Can the executive reasonably conclude that the ownership of VCR's is higher in cable systems?
-What are the null and alternative hypotheses?
H0: ________________
H1: ________________
(Essay)
4.8/5 (40)
Financial analyst
A financial analyst is to estimate the difference in the average return-on-equity for two industry groups,bank and bank holding companies and nonblank financial companies.The sample data obtained: Bank Nonblank =32 =31 =13.10 =9.90 =23.80 =102.57
-Construct a 98-percent confidence interval for the true difference in means for the return-on-equity between bank and bank holding companies and nonblank financial companies.
____________________ to ____________________
(Short Answer)
4.9/5 (39)
Filters
- Essay(0)
- Multiple Choice(0)
- Short Answer(0)
- True False(0)
- Matching(0)