Exam 11: Hypothesis Tests Involving Two Sample Means
Exam 1: A Preview of Business Statistics55 Questions
Exam 2: Visual Description of Data67 Questions
Exam 3: Statistical Description of Data146 Questions
Exam 4: Data Collection and Sampling Methods104 Questions
Exam 5: Probability: Review of Basic Concepts188 Questions
Exam 6: Discrete Probability Distributions140 Questions
Exam 7: Continuous Probability Distributions160 Questions
Exam 8: Sampling Distributions108 Questions
Exam 9: Estimation From Sample Data150 Questions
Exam 10: Hypothesis Tests Involving a Sample Mean or Proportion170 Questions
Exam 11: Hypothesis Tests Involving Two Sample Means149 Questions
Exam 12: Analysis of Variance Tests173 Questions
Exam 13: Chi-Square Applications134 Questions
Exam 14: Nonparametric Methods139 Questions
Exam 15: Simple Linear Regression and Correlation145 Questions
Exam 16: Multiple Regression and Correlation98 Questions
Exam 17: Model Building83 Questions
Exam 18: Models for Time Series and Forecasting127 Questions
Exam 19: Decision Theory82 Questions
Exam 20: Total Quality Management132 Questions
Select questions type
Smoking
In an effort to test the hypothesis that the proportion of males who smoke cigarettes regularly is greater than the proportion of females who smoke cigarettes regularly,the following data was collected.
Mopulation Number Wha Smoke Sample Sire Male Female 180 775
-Use = 0.05.State your conclusions in terms of the test statistic.
(Essay)
4.7/5  (31)
(31)
When either test can be applied to the same data,the z-test for comparing the means of two independent samples is preferable to the unequal-variances t-tests,especially when doing the test with computer assistance.
(True/False)
4.9/5 (28)
____________________ samples are those for which the selection process for one is not related to the selection process for the other.
(Short Answer)
4.9/5 (37)
Textbook
A large textbook publisher is concerned about the sale of complimentary desk copies of textbooks to wholesale book buyers.The publisher randomly samples the faculty from two universities,A and B.Information provided by salespeople suggests that the faculty at University A had copies of the publisher's books that had been shipped,whereas the faculty at University B seldomly had them.Let be the proportion of faculty at University A who sell this publisher's books and be the proportion of faculty at University B who sell this publisher's books.The samples provide these data: 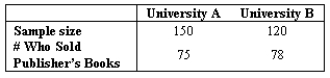 At the 0.05 significance level,is this publisher reasonably justified in saying there is a higher proportion of faculty at University B who sell this publisher's complimentary books than at University A?
-What is the value of the test statistic?
Appropriate test: ____________________
Test statistic = ____________________
At the 0.05 significance level,is this publisher reasonably justified in saying there is a higher proportion of faculty at University B who sell this publisher's complimentary books than at University A?
-What is the value of the test statistic?
Appropriate test: ____________________
Test statistic = ____________________
(Short Answer)
4.8/5 (43)
Battery
A new brand of battery for use in calculators and cameras is said to last significantly longer than another brand.A camera manufacturer is to test this brand (Y)with brand (X)to see if brand Y has a longer life.If brand Y does last longer,the camera manufacturer will equip their new cameras with them.If not,they will equip them with brand X that is less costly.Twenty cameras are equipped as follows: ten with brand Y batteries and ten with brand X batteries and the life of the batteries measured.Is brand Y superior (does it last longer)to brand X? To answer this question,the camera manufacturer uses a 0.01 significance level and knows that the populations are normally distributed with equal variances.Sample data are: Brand Brand =10 =10 =500 hours =650 hours =400 =484
-What is the test statistic?
Appropriate test: ____________________
Test statistic = ____________________
(Short Answer)
4.8/5 (42)
Women drivers
In the past,young women drivers have maintained a better driving record than young men drivers.An insurance company is concerned with the driving record of its insured customers.Specifically,it conducts a test for the number of speeding tickets received during the past year by drivers between the ages of 18 and 25. Men Women =120 =85 =1.2 =0.4 =24.8 =10.6
-A test for the equality of average number of tickets per driver for the two groups is desired.Use = 0.01.What is the value of the test statistic?
Appropriate test: ____________________
Test statistic = ____________________
(Short Answer)
4.9/5 (32)
Population
In an effort to test the hypothesis that the proportion of home ownership in the state of Delaware is different than the national proportion,the following data was collected.
Population Number of Home Owners Sample Size Delaware 310 500 Nation 390 600
-State the null and alternative hypotheses.
(Essay)
4.8/5 (32)
There are three different methods for comparing the means of two independent samples.What are they?
(Essay)
4.7/5 (35)
The comparison of sample proportions from two independent samples relies on the t-distribution and assumes that the two populations are normally distributed.
(True/False)
4.7/5 (35)
In testing the difference between two population means using two independent samples,the sampling distribution of the sample mean difference is normal if the:
(Multiple Choice)
4.8/5 (31)
1000 companies
From the top 1000 companies in valuation,a comparison of the mean dividend yield of the top and bottom ten electric utility companies is desired.Let 1 = top ten,and 2 = bottom ten,electric utility companies respectively.The data shown below are for two independent samples,which are drawn at random from populations that are normally distributed. Top ten Bottom ten 8.76 6.65 8.96 6.38 7.20 6.24 8.92 6.93 8.61 7.46 7.81 0.00 6.58 7.78 8.06 8.64 6.42 7.35 6.64 7.33
-Use Excel or Minitab to summarize the data using descriptive statistics
(Essay)
4.8/5 (40)
A special hypothesis test,based on the t-distribution,can be applied to test the null hypothesis that the population variances are equal for two independent samples.
(True/False)
4.9/5 (35)
Battery Manufacturer
A battery manufacturer claims that their new "long-lasting" battery has an average life that is significantly longer than their competitor's "regular" battery.Both types of batteries were tested and the number of hours each battery lasted is shown in the following table.
Long-Leasting Battery (Pupulation 1) Regular Battery (Pupulation 2) 51 42 44 29 58 51 36 38 48 39 53 44 57 35 40 40 49 48 44 45 60 50
-Assume unequal variances.Using = 0.01,state the decision rule in terms of the critical value.
(Short Answer)
4.9/5 (34)
Weight loss
A new diet program claims that clients will lose weight after 7 days on the program.To validate their claim,they recorded the starting and ending weight of 11 individuals over a 7-day period.The results are shown in the following table.
Starting Waight Ending Weight 221 218 215 210 206 204 236 241 214 212 256 250 240 245 222 218 239 230 218 215 229 220
-State the null and alternative hypotheses.
(Essay)
4.9/5 (31)
Slacks Manufacturer
A slacks manufacturer is deciding whether to purchase a new method for bonding seams together.Before purchasing a new method that bonds,or glues,the seams together,the manufacturer wishes to determine whether or not the "bonded" seams can withstand more pulling stress than standard seams sewn with thread.The creator of the new method provides a demonstration machine and supplies for the slacks maker to test.Two samples of the slacks produced are taken.Each pair of slacks has the seams tested in an application of force to determine the breaking point (in lbs.)for the seam.The sample results are: Sample 1: Sewn Sample 2: Glued =50 =50 =125. =165. =46. =57.
-The test question is: At the 0.05 level of significance,is the gluing of seams better than sewing? What is the value of the test statistic?
Appropriate test: ____________________
Test statistic = ____________________
(Short Answer)
4.8/5 (32)
When the necessary conditions are met,a two-tail test is being conducted to test the difference between two population proportions.The two sample proportions are p1 = 0.25 and p2 = 0.20,and the standard error of the sampling distribution of p1 - p2 is 0.04.The calculated value of the test statistic will be:
(Multiple Choice)
4.8/5 (33)
One of the most useful applications of business statistics involves comparing two samples to examine whether a difference between them is significant or more likely due to chance variation from one sample to the next.
(True/False)
4.9/5 (35)
Battery
A new brand of battery for use in calculators and cameras is said to last significantly longer than another brand.A camera manufacturer is to test this brand (Y)with brand (X)to see if brand Y has a longer life.If brand Y does last longer,the camera manufacturer will equip their new cameras with them.If not,they will equip them with brand X that is less costly.Twenty cameras are equipped as follows: ten with brand Y batteries and ten with brand X batteries and the life of the batteries measured.Is brand Y superior (does it last longer)to brand X? To answer this question,the camera manufacturer uses a 0.01 significance level and knows that the populations are normally distributed with equal variances.Sample data are: Brand Brand =10 =10 =500 hours =650 hours =400 =484
-What is the decision rule?
(Essay)
5.0/5 (29)
In testing for the equality of two population variances,when the populations are normally distributed,the 10% level of significance has been used.To determine the rejection region,it will be necessary to refer to the F table corresponding to an upper-tail area of:
(Multiple Choice)
4.9/5 (37)
Price earnings
A comparison of the price-earnings (P/E)ratio for the top and bottom 100 companies in valuation is being prepared.A financial advisor randomly sampled each group to determine whether there is any difference in P/E ratios of the two groups of companies.Let 1 = a top 100 company and 2 = a bottom 100 company.Assume equal population variances and that the populations are normally distributed.The advisor is to use a 0.01 significance level.The data were randomly selected and are summarized below: Top 100 company Bottom 100 company =6 =6 =18.83 =10.67 =128.17 =8.67
Calculate the standard error of the estimate.
(Short Answer)
4.8/5 (34)
Filters
- Essay(0)
- Multiple Choice(0)
- Short Answer(0)
- True False(0)
- Matching(0)