Exam 20: Unemployment and Inflation
Exam 1: Economics: Foundations and Models444 Questions
Exam 2: Trade-Offs, Comparative Advantage, and the Market System498 Questions
Exam 3: Where Prices Come From: the Interaction of Demand and Supply475 Questions
Exam 4: Economic Efficiency, Government Price Setting, and Taxes419 Questions
Exam 5: Externalities, Environmental Policy, and Public Goods266 Questions
Exam 6: Elasticity: the Responsiveness of Demand and Supply295 Questions
Exam 7: The Economics of Health Care334 Questions
Exam 8: Firms, the Stock Market, and Corporate Governance278 Questions
Exam 9: Comparative Advantage and the Gains From International Trade379 Questions
Exam 10: Consumer Choice and Behavioral Economics302 Questions
Exam 11: Technology, Production, and Costs330 Questions
Exam 12: Firms in Perfectly Competitive Markets298 Questions
Exam 13: Monopolistic Competition: the Competitive Model in a More Realistic Setting276 Questions
Exam 14: Oligopoly: Firms in Less Competitive Markets262 Questions
Exam 15: Monopoly and Antitrust Policy271 Questions
Exam 16: Pricing Strategy263 Questions
Exam 17: The Markets for Labor and Other Factors of Production286 Questions
Exam 18: Public Choice, Taxes, and the Distribution of Income258 Questions
Exam 19: GDP: Measuring Total Production and Income266 Questions
Exam 20: Unemployment and Inflation292 Questions
Exam 21: Economic Growth, the Financial System, and Business Cycles257 Questions
Exam 22: Long-Run Economic Growth: Sources and Policies268 Questions
Exam 23: Aggregate Expenditure and Output in the Short Run306 Questions
Exam 24: Aggregate Demand and Aggregate Supply Analysis284 Questions
Exam 25: Money, Banks, and the Federal Reserve System280 Questions
Exam 26: Monetary Policy277 Questions
Exam 27: Fiscal Policy303 Questions
Exam 28: Inflation, Unemployment, and Federal Reserve Policy257 Questions
Exam 29: Macroeconomics in an Open Economy278 Questions
Exam 30: The International Financial System262 Questions
Select questions type
If your nominal wage rises more slowly than the price level, we can say your real wage has ________ and the purchasing power of a dollar has ________.
(Multiple Choice)
4.7/5  (37)
(37)
The consumer price index implicitly assumes that the demand curve for each good and service in the representative market basket is
(Multiple Choice)
4.8/5 (32)
Upon your graduation from college, you find that the economy is in recession and the unemployment rate is relatively high. Nonetheless, you continue along your career path looking for a new job because
(Multiple Choice)
5.0/5 (34)
Suppose that homemakers are included as employed in the labor force statistics, rather than being counted as out of the labor force. This would
(Multiple Choice)
4.9/5 (42)
The unemployment rate in the United States is typically lower than in Western Europe because the United States has tougher requirements for the unemployed to receive government payments.
(True/False)
4.7/5 (35)
Between 2013 and 2014, the CPI of a small nation rose from 182 to 185. If household incomes rose by 3% during that period of time, which of the following is true?
(Multiple Choice)
4.9/5 (28)
Table 20-7
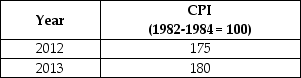 -Refer to Table 20-7. Suppose that the data in the table above reflect price levels in the economy. What is the inflation rate between 2012 and 2013?
(Multiple Choice)
4.8/5 (31)
Most economists believe that the biases in the consumer price index cause the CPI to overstate the true inflation rate by about
(Multiple Choice)
4.8/5 (32)
Table 20-19
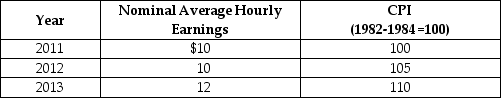 -Refer to Table 20-19. Looking at the table above, what is the rate of growth of the average price level from 2011 to 2012?
(Multiple Choice)
4.8/5 (23)
Monthly expenditures for a family of 4 in 2012 averaged $1,400. In 2013, the cost of the same purchases was $1,500. If 2012 is the base year, what was the CPI in 2013?
(Multiple Choice)
4.7/5 (33)
Table 20-18
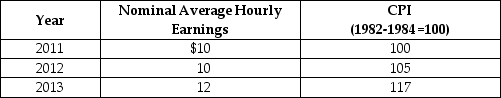 -Refer to Table 20-18. Looking at the table above, what is the rate of growth of real average hourly earnings from 2012 to 2013?
(Multiple Choice)
4.9/5 (40)
Suppose you obtain a fixed rate mortgage during a period of relatively high inflation. During the next ten years, inflation falls. Are you a winner or a loser due to inflation? Explain why.
(Essay)
4.8/5 (39)
Table 20-20
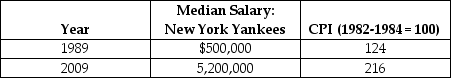 Salaries in major league baseball have soared over the last 30 to 40 years. Some of the salary increase is due to inflation. The table above reports the consumer price index and the median nominal salary of the New York Yankees for 1989 and 2009.
Source: USA Today Salaries Database, asp.usatoday.com/sports/baseball/salaries/default.aspx
-Refer to Table 20-20. Calculate the real median salary of the New York Yankees in both 1982-1984 dollars and 2009 dollars. Calculate the percentage increase in the median salary of the Yankees from 1989 to 2009 in both nominal terms and in real terms.
Salaries in major league baseball have soared over the last 30 to 40 years. Some of the salary increase is due to inflation. The table above reports the consumer price index and the median nominal salary of the New York Yankees for 1989 and 2009.
Source: USA Today Salaries Database, asp.usatoday.com/sports/baseball/salaries/default.aspx
-Refer to Table 20-20. Calculate the real median salary of the New York Yankees in both 1982-1984 dollars and 2009 dollars. Calculate the percentage increase in the median salary of the Yankees from 1989 to 2009 in both nominal terms and in real terms.
(Essay)
4.9/5 (39)
Suppose the working-age population of a fictional economy falls into the following categories: 90 are retired or homemakers; 60 have full-time employment; 20 have part-time employment; 20 do not have employment, but are actively looking for employment; and 10 would like employment but do not have employment and are not actively looking for employment. The official unemployment rate as calculated by the U.S. Bureau of Labor would equal
(Multiple Choice)
4.9/5 (34)
Filters
- Essay(0)
- Multiple Choice(0)
- Short Answer(0)
- True False(0)
- Matching(0)