Exam 18: Public Choice, taxes, and the Distribution of Income
Exam 1: Economics: Foundations and Models142 Questions
Exam 2: Trade-Offs, comparative Advantage, and the Market System152 Questions
Exam 3: Where Prices Come From: the Interaction of Demand and Supply149 Questions
Exam 4: Economic Efficiency, government Price Setting, and Taxes137 Questions
Exam 5: Externalities, environmental Policy, and Public Goods139 Questions
Exam 6: Elasticity: The Responsiveness of Demand and Supply149 Questions
Exam 7: The Economics of Health Care117 Questions
Exam 8: Firms, the Stock Market, and Corporate Governance140 Questions
Exam 9: Comparative Advantage and the Gains From International Trade124 Questions
Exam 10: Consumer Choice and Behavioral Economics154 Questions
Exam 11: Technology, production, and Costs174 Questions
Exam 12: Firms in Perfectly Competitive Markets153 Questions
Exam 13: Monopolistic Competition: The Competitive Model in a More Realistic Setting137 Questions
Exam 14: Oligopoly: Firms in Less Competitive Markets129 Questions
Exam 15: Monopoly and Antitrust Policy148 Questions
Exam 16: Pricing Strategy134 Questions
Exam 17: The Markets for Labor and Other Factors of Production149 Questions
Exam 18: Public Choice, taxes, and the Distribution of Income134 Questions
Exam 19: GDP: Measuring Total Production and Income135 Questions
Exam 20: Unemployment and Inflation148 Questions
Exam 21: Economic Growth, the Financial System, and Business Cycles130 Questions
Exam 22: Long-Run Economic Growth: Sources and Policies134 Questions
Exam 23: Aggregate Expenditure and Output in the Short Run157 Questions
Exam 24: Aggregate Demand and Aggregate Supply Analysis145 Questions
Exam 25: Money, banks, and the Federal Reserve System144 Questions
Exam 26: Monetary Policy145 Questions
Exam 27: Fiscal Policy155 Questions
Exam 28: Inflation, unemployment, and Federal Reserve Policy135 Questions
Exam 29: Macroeconomics in an Open Economy145 Questions
Exam 30: The International Financial System139 Questions
Select questions type
The Center for Science in the Public Interest claims that an 8-cent tax on a 12-ounce serving of soda would raise ________ per year.
(Multiple Choice)
4.8/5  (30)
(30)
Consider a public good such as fire protection services.Rich people may benefit more than the poor from such a service because rich people stand to lose more from a fire that destroys property.In this case,
(Multiple Choice)
4.9/5 (42)
If you pay $2,000 in taxes on an income of $20,000,and a tax of $3,000 on an income of $30,000,then over this range of income the tax is
(Multiple Choice)
4.8/5 (33)
If,as your taxable income decreases,you pay a larger percentage of your taxable income in taxes,then the tax is
(Multiple Choice)
4.8/5 (44)
If the marginal tax rate is less than the average tax rate as taxable income increases,the tax structure is
(Multiple Choice)
4.8/5 (36)
Figure 18-2 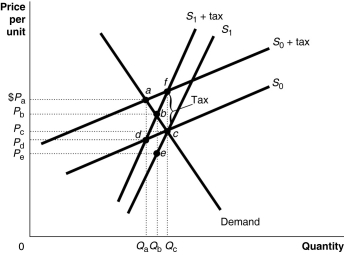 Figure 18-2 shows a demand curve and two sets of supply curves, one set more elastic than the other.
-Refer to Figure 18-2.If the government imposes an excise tax of $1.00 on every unit sold,the government's revenue from the tax is represented by the area
Figure 18-2 shows a demand curve and two sets of supply curves, one set more elastic than the other.
-Refer to Figure 18-2.If the government imposes an excise tax of $1.00 on every unit sold,the government's revenue from the tax is represented by the area
(Multiple Choice)
4.8/5 (35)
Figure 18-2
Figure 18-2 shows a demand curve and two sets of supply curves, one set more elastic than the other.
-Refer to Figure 18-2.If the government imposes an excise tax of $1.00 on every unit sold,the producer's burden of the tax
(Multiple Choice)
4.9/5 (40)
If the Gini coefficient for Cartland is 1,it means that income distribution is perfectly equal in this society.
(True/False)
4.8/5 (29)
Figure 18-5  Figure 18-5 shows the Lorenz curves for Islandia and Syldavia.
-Refer to Figure 18-5.If area X = 2,060,area Y = 240,and area Z = 2,700,calculate the Gini coefficient for Islandia.
Figure 18-5 shows the Lorenz curves for Islandia and Syldavia.
-Refer to Figure 18-5.If area X = 2,060,area Y = 240,and area Z = 2,700,calculate the Gini coefficient for Islandia.
(Multiple Choice)
4.8/5 (44)
Consider the following methods of taxing a corporation's income: a.A flat tax,as opposed to a progressive tax,is levied on corporate profits.
B)A system whereby a corporation calculates its annual profit and notifies each shareholder of her portion of the profits.The shareholder would then be required to include this amount as taxable income for her personal income tax.The corporation does not pay a tax.
C)A system where the federal government continues to tax corporate income through the corporate income tax but allows individual taxpayers to receive,tax free,corporate dividends and capital gains.
Which of the methods above would avoid double taxation?
A) a, b, and c
B) a and b only
C) a and c only
D) b and c only
(Not Answered)
This question doesn't have any answer yet
Figure 18-6  -Refer to Figure 18-6 to answer the following questions.
a.Did the distribution of income become more equal in 2010 that it was in 2009,or did it become less equal? Explain.
b.If area A = 1,600,area B = 200,and area C = 3,200,calculate the Gini coefficient for 2009 and the Gini coefficient for 2010.
-Refer to Figure 18-6 to answer the following questions.
a.Did the distribution of income become more equal in 2010 that it was in 2009,or did it become less equal? Explain.
b.If area A = 1,600,area B = 200,and area C = 3,200,calculate the Gini coefficient for 2009 and the Gini coefficient for 2010.
(Essay)
4.9/5 (32)
Filters
- Essay(0)
- Multiple Choice(0)
- Short Answer(0)
- True False(0)
- Matching(0)