Exam 28: Multiple Regression Wisdom
Exam 1: Stats Starts Here33 Questions
Exam 2: Displaying and Describing Categorical Data70 Questions
Exam 3: Displaying and Summarizing Quantitative Data148 Questions
Exam 4: Understanding and Comparing Distributions46 Questions
Exam 5: The Standard Deviation As a Ruler and the Normal Model111 Questions
Exam 6: Scatterplots, association, and Correlation78 Questions
Exam 7: Linear Regression71 Questions
Exam 8: Regression Wisdom32 Questions
Exam 9: Understanding Randomness26 Questions
Exam 10: Sample Surveys64 Questions
Exam 11: Experiments and Observational Studies80 Questions
Exam 12: From Randomness to Probability69 Questions
Exam 13: Probability Rules95 Questions
Exam 14: Random Variables215 Questions
Exam 15: Sampling Distribution Models51 Questions
Exam 16: Confidence Intervals for Proportions71 Questions
Exam 17: Testing Hypotheses About Proportions44 Questions
Exam 18: More About Tests67 Questions
Exam 19: Comparing Two Proportions53 Questions
Exam 20: Inferences About Means123 Questions
Exam 21: Comparing Means50 Questions
Exam 22: Paired Samples and Blocks35 Questions
Exam 23: Comparing Counts76 Questions
Exam 24: Inferences for Regression57 Questions
Exam 25: Analysis of Variance39 Questions
Exam 26: Multifactor Analysis of Variance22 Questions
Exam 27: Multiple Regression22 Questions
Exam 28: Multiple Regression Wisdom21 Questions
Exam 29: Rank-Based Nonparametric Tests29 Questions
Exam 30: The Bootstrap27 Questions
Select questions type
How would you interpret the coefficient of sex in this model?
Free
(Essay)
4.8/5  (35)
(35)
Correct Answer: Verified
The coefficient of sex is rather small and it's not statistically significant.We have no evidence that it contributes significantly to weight.
Here are plots of data for Studentized residuals against Chest. 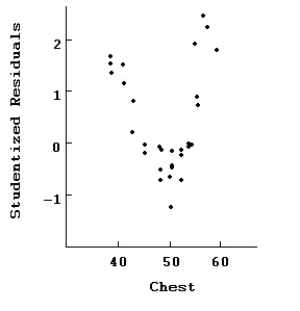 Interpret this plot of the residuals.
Free
(Essay)
4.7/5 (37)
Correct Answer:Verified
It appears that there is a problem with the independence assumption as there is a clear pattern in the residual plot.
An actuary wishes to predict the life expectancy of a person based on several variables.One categorical variable of interest is their relationship status - single,married,divorced,widowed,or common-law.If the actuary wished to include "relationship status" in a regression model,how many indicator variables would he/she need to use in the model?
Free
(Multiple Choice)
4.8/5 (33)
Correct Answer:Verified
A
How would you interpret the coefficient of Science in the multiple regression?
(Essay)
4.8/5 (32)
Here are plots for Studentized residuals against Chest.  Here is the same regression with the two data points with residuals above 2 removed:
Dependent variable is: Weight
30 total bears of which 2 are missing
R-squared = 93.8% R-squared (adjusted)= 93.0%
s = 7.22 with 28 - 4 = 24 degrees of freedom Sum of Mean Source Squares DF Square F-ratio Regression 21671 3 7223.67 123.23 Residual 1406.88 24 58.62 Variable Coefficient SE(Coeff) t-ratio P-value Intercept -167.52 7.47 -22.43 <0.0001 Chest 3.01 2.98 1.01 0.3218 Length 4.05 1.53 2.65 0.0135 Sex -2.03 2.14 -0.95 0.3509 Compare the regression with the previous one.In particular,which model is likely to make the best prediction of weight? Which seems to fit the data better?
Here is the same regression with the two data points with residuals above 2 removed:
Dependent variable is: Weight
30 total bears of which 2 are missing
R-squared = 93.8% R-squared (adjusted)= 93.0%
s = 7.22 with 28 - 4 = 24 degrees of freedom Sum of Mean Source Squares DF Square F-ratio Regression 21671 3 7223.67 123.23 Residual 1406.88 24 58.62 Variable Coefficient SE(Coeff) t-ratio P-value Intercept -167.52 7.47 -22.43 <0.0001 Chest 3.01 2.98 1.01 0.3218 Length 4.05 1.53 2.65 0.0135 Sex -2.03 2.14 -0.95 0.3509 Compare the regression with the previous one.In particular,which model is likely to make the best prediction of weight? Which seems to fit the data better?
(Essay)
4.9/5 (38)
Here are plots of data for Studentized residuals against Length. 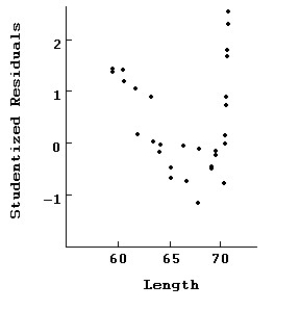 Interpret this plot of the residuals.
(Essay)
4.8/5 (34)
The manager of a human resources department wishes to predict the salary of an employee based on years of experience,x,and gender,g.(g = 1 for a male employee and 0 for a female employee.)A random sample of 50 employees results in the following least-squares regression equation: Interpret the value of the coefficient of gender (g).
(Multiple Choice)
4.9/5 (35)
Here are plots of data for Studentized residuals against Length.  Here is the same regression with all of the points at 70 removed.
Dependent variable is: Weight
30 total bears of which 10 are missing
R-squared = 97.8% R-squared (adjusted)= 97.3%
s = 2.96 with 20 - 4 = 16 degrees of freedom Sum of Mean Source Squares DF Square F-ratio Regression 7455.0 3 2485 238.26 Residual 166.89 16 10.43 Variable Coefficient SE(Coeff) t-ratio P-value Intercept -169.16 3.23 -52.37 <0.0001 Chest 0.84 0.58 1.45 0.1590 Length 5.59 2.14 2.61 0.0148 Sex -1.19 1.98 -0.60 0.5537 Compare the regression with the previous one.In particular,which model is likely to make the best prediction of weight? Which seems to fit the data better?
Here is the same regression with all of the points at 70 removed.
Dependent variable is: Weight
30 total bears of which 10 are missing
R-squared = 97.8% R-squared (adjusted)= 97.3%
s = 2.96 with 20 - 4 = 16 degrees of freedom Sum of Mean Source Squares DF Square F-ratio Regression 7455.0 3 2485 238.26 Residual 166.89 16 10.43 Variable Coefficient SE(Coeff) t-ratio P-value Intercept -169.16 3.23 -52.37 <0.0001 Chest 0.84 0.58 1.45 0.1590 Length 5.59 2.14 2.61 0.0148 Sex -1.19 1.98 -0.60 0.5537 Compare the regression with the previous one.In particular,which model is likely to make the best prediction of weight? Which seems to fit the data better?
(Essay)
4.9/5 (38)
Here is the scatterplot of externally Studentized residuals against predicted values: 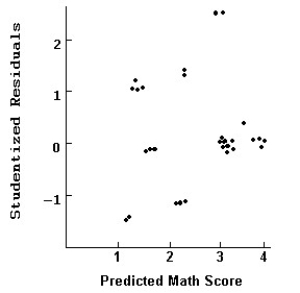 Comment on what this diagnostic display indicates.
(Essay)
4.8/5 (28)
A real estate agent wishes to predict the selling price of a home based on several variables.One categorical variable of interest is the quality of the home - low,medium,or high.If the real estate agent wished to include "quality" in a regression model,how many indicator variables would he/she need to use in the model?
(Multiple Choice)
4.8/5 (26)
The manager of a human resources department wishes to predict the salary of an employee based on years of experience,x,and gender,g.(g = 1 for a male employee and 0 for a female employee.)A random sample of 50 employees results in the following least-squares regression equation: What is the least-squares regression line for predicting the salary of male employees?
(Multiple Choice)
4.9/5 (32)
What is the purpose of an indicator variable in a regression model?
(Multiple Choice)
4.9/5 (29)
The manager of a human resources department wishes to predict the salary of an employee based on years of experience,x,and gender,g.(g = 1 for a male employee and 0 for a female employee.)A random sample of 50 employees results in the following least-squares regression equation: What is the least-squares regression line for predicting the salary of female employees?
(Multiple Choice)
4.8/5 (37)
Here are histograms of the leverage and Studentized residuals for the regression model: 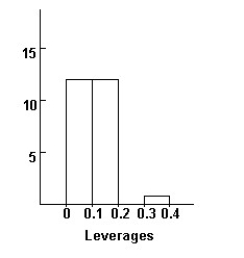
 Comment on what these diagnostic displays indicate.
(Essay)
4.8/5 (35)
The manager of a human resources department wishes to predict the salary of an employee based on years of experience,x,and gender,g.(g = 1 for a male employee and 0 for a female employee.)A random sample of 50 employees results in the following least-squares regression equation: Interpret the value of the coefficient of the interaction term xg.
(Multiple Choice)
4.9/5 (34)
The manager of a human resources department wishes to predict the salary of an employee based on years of experience,x,and gender,g.(g = 1 for a male employee and 0 for a female employee.)A random sample of 50 employees results in the following least-squares regression equation: What is the least-squares regression line for predicting the salary of male employees?
(Multiple Choice)
4.8/5 (29)
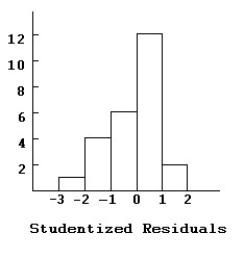
A histogram of the externally Studentized residuals looks like this:  Comment on the distribution of the Studentized Residuals.
(Essay)
4.8/5 (41)
The manager of a human resources department wishes to predict the salary of an employee based on years of experience,x,and gender,g.(g = 1 for a male employee and 0 for a female employee.)A random sample of 50 employees results in the following least-squares regression equation: Predict the salary for a male employee with 15 years of experience.
(Multiple Choice)
4.8/5 (36)
Here are histograms of the leverage and Studentized residuals for the regression model: 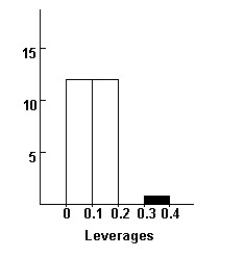
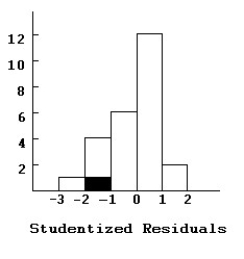 The 14th employee who was hired is highlighted in both displays.Do you think this employee is an influential case?
(Essay)
4.8/5 (29)
Here is a histogram of leverages for this regression: 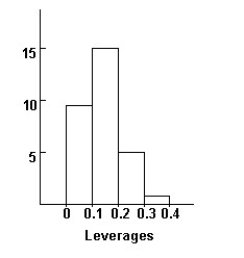 Without doing any calculating,how would you expect the coefficient and t-statistic of English to change if we were to omit the 6 highest leverage points?
(Essay)
4.9/5 (38)
Filters
- Essay(0)
- Multiple Choice(0)
- Short Answer(0)
- True False(0)
- Matching(0)