Exam 3: Displaying and Summarizing Quantitative Data
Exam 1: Stats Starts Here33 Questions
Exam 2: Displaying and Describing Categorical Data70 Questions
Exam 3: Displaying and Summarizing Quantitative Data148 Questions
Exam 4: Understanding and Comparing Distributions46 Questions
Exam 5: The Standard Deviation As a Ruler and the Normal Model111 Questions
Exam 6: Scatterplots, association, and Correlation78 Questions
Exam 7: Linear Regression71 Questions
Exam 8: Regression Wisdom32 Questions
Exam 9: Understanding Randomness26 Questions
Exam 10: Sample Surveys64 Questions
Exam 11: Experiments and Observational Studies80 Questions
Exam 12: From Randomness to Probability69 Questions
Exam 13: Probability Rules95 Questions
Exam 14: Random Variables215 Questions
Exam 15: Sampling Distribution Models51 Questions
Exam 16: Confidence Intervals for Proportions71 Questions
Exam 17: Testing Hypotheses About Proportions44 Questions
Exam 18: More About Tests67 Questions
Exam 19: Comparing Two Proportions53 Questions
Exam 20: Inferences About Means123 Questions
Exam 21: Comparing Means50 Questions
Exam 22: Paired Samples and Blocks35 Questions
Exam 23: Comparing Counts76 Questions
Exam 24: Inferences for Regression57 Questions
Exam 25: Analysis of Variance39 Questions
Exam 26: Multifactor Analysis of Variance22 Questions
Exam 27: Multiple Regression22 Questions
Exam 28: Multiple Regression Wisdom21 Questions
Exam 29: Rank-Based Nonparametric Tests29 Questions
Exam 30: The Bootstrap27 Questions
Select questions type
A small company employs a supervisor at $1100 a week,an inventory manager at $700 a week,6 stock boys at $400 a week,and 4 drivers at $600 a week.Which measure of spread,would best describe the payroll,the range,the IQR,or the standard deviation?
Free
(Multiple Choice)
4.9/5  (35)
(35)
Correct Answer: Verified
E
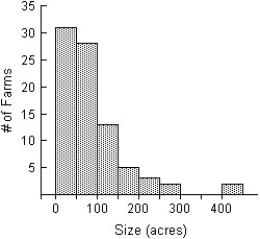
Ontario wanted to find the typical size of farms in the province.The data below shows the sizes (in acres)of the 84 farms located in Ontario.Create a histogram of the data using bins that are 50 acres wide.
200 172 52 100 85 100
50 63 16 64 40 54
8 25 212 67 125 250
400 142 65 49 45 9
32 33 41 112 99 50
88 66 135 18 37 38
103 296 98 77 85 29
73 48 48 167 15 100
149 59 80 21 141 33
21 130 49 37 139 17
95 40 5 440 21 60
19 199 147 46 90 26
61 91 28 84 47 159
182 73 71 249 50 92
Free
(Essay)
4.8/5 (30)
Correct Answer:Verified
A small company employs a supervisor at $1400 a week,an inventory manager at $800 a week,8 stock boys at $300 a week each,and 6 drivers at $700 a week each.
Free
(Multiple Choice)
4.8/5 (30)
Correct Answer:Verified
E
During student-teacher negotiations at a certain high school,teachers seek to change the number of times students are allowed to be tardy,saying that the semester "average" is 8 days of tardiness per student.The students counter that the "average" student is only tardy 4 times per semester.Explain how both sides may be correct,identifying the measure of centre you think each side is using and why the difference might exist.
(Essay)
4.8/5 (39)
Shown below are the boxplot,the histogram and summary statistics for the highest temperatures ever recorded (in °F)in 32 different states in the U.S.A.. 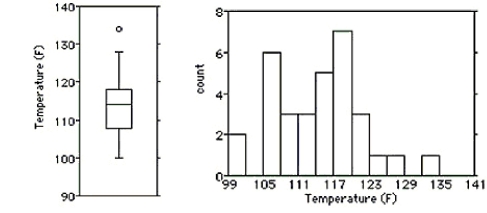 Count Mean Median StdDev Min Max Q1 Q3 32 114.2 114.5 7.7 100 134 107.5 118 Write a few sentences describing the distribution.
(Multiple Choice)
4.7/5 (43)
The test scores of 15 students are listed below. 41 44 48 55 59 61 67 71 72 78 85 87 90 94 95
(Multiple Choice)
4.8/5 (34)
The mathematics department at a Canadian university collected data for the number of students enrolled in 40 math courses over the course of one year.The following stem-and-leaf display shows the total number of students enrolled in each class. Class Size Totals 12
11
10
9
8
7
6
5
4
3 233 45 2468 3568 22588 468 22359 3389 23366 66789 Key:
10 = 106 students
(Multiple Choice)
4.9/5 (36)
A business owner recorded her annual profits for the first 12 years since opening her business.The stem-and-leaf display below shows the annual profits in thousands of dollars. Annual Profit Totals 14
13
12
11
10
9
8
7 0133 8 012 8 13 7 Key:
13 = $138,000 profit
(Multiple Choice)
4.9/5 (29)
The histograms show the cost of living,in dollars,for 32 U.S.cities.The histogram on the left shows the cost of living for the 32 cities using bins $10 wide,and the histogram on the right displays the same data using bins that are $6 wide.For which of the histograms would you most strenuously insist on using an IQR rather than a standard deviation to summarize spread? Explain. 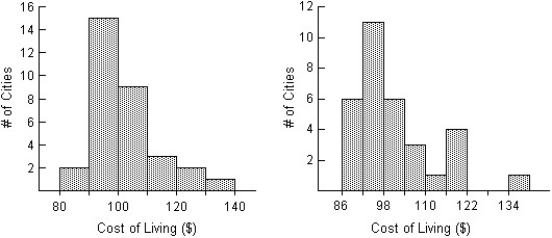
(Multiple Choice)
4.9/5 (37)
A local ice cream shop hand scoops each of its ice cream cones.The cones vary in weight from 126 grams to 291 grams with a mean of 181 grams and a standard deviation of 34 grams.The quartiles and median weights are 157,255,and 202 ounces.A customer makes a special order of a 448 ounce cone. Which of the summary statistics might not change if that data value was added to the distribution?
(Multiple Choice)
4.8/5 (36)
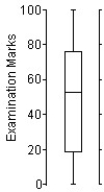
Here is an ogive of the distribution of students' marks on their statistics test. 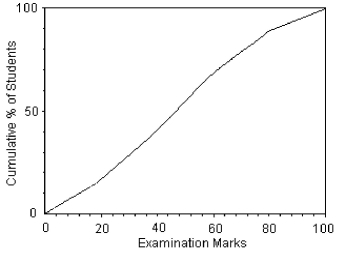 Choose the boxplot that represents the given data.
I
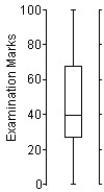
Choose the boxplot that represents the given data.
I 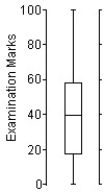 II
II
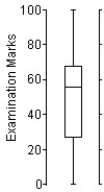
 III
III
 IV
IV 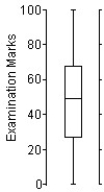 V
V
(Multiple Choice)
4.8/5 (33)
Here are summary statistics for the time,in minutes,it took 21 students to write a statistics test. Count Mean Median StdDev Min Max Q1 Q3 21 23.9 22.0 12.2 5.1 51.7 15.4 33.4 Would you describe this distribution as symmetric or skewed?
(Multiple Choice)
4.7/5 (39)
Here are the grocery bills,in dollars,for six shoppers. Round your answer to the nearest cent.
(Multiple Choice)
4.9/5 (36)
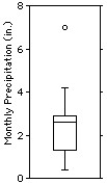
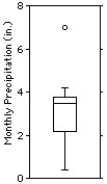
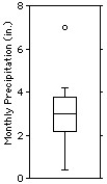
The normal monthly precipitation (in inches)for August is listed for 20 different cities in Canada. 0.4 1.0 1.5 1.6 2.0
2.2 2.4 2.7 3.4 3.4
3.5 3.6 3.6 3.7 3.7
3.9 4.1 4.2 4.2 7.0 Choose the boxplot that represents the given data.
I  II
II
 III
III
 IV
IV 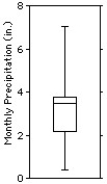 V
V
(Multiple Choice)
4.8/5 (23)
The frequency table shows the weight,in kilograms,of 130 adults,rounded to the nearest kilogram. Weight Count Weight Count 60 3 68 23 61 4 69 6 62 4 70 13 63 8 71 10 64 8 72 9 65 5 73 6 66 9 74 4 67 16 75 2
(Multiple Choice)
4.9/5 (34)
A small company employs a supervisor at $1300 a week,an inventory manager at $800 a week,7 stock boys at $400 a week,and 5 drivers at $700 a week.Which measure of centre best describes a typical wage at this company,the mean at $600 or the median at $550?
(Multiple Choice)
4.8/5 (28)
The histogram shows the lengths of hospital stays (in hours)for pregnant women admitted to hospitals in Ontario who were having contractions upon arrival. 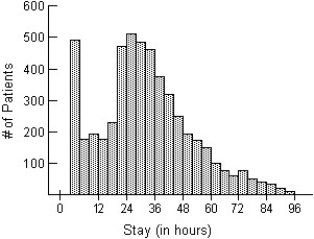
(Multiple Choice)
4.8/5 (36)
The weights,in kilograms,of 18 randomly selected adults are given below.Find the range. 54.4 74.8 84.8 64.9 54.0 59.9
57.6 70.8 81.2 72.1 81.6 91.6
51.7 66.2 68.5 76.2 78.5 65.3
(Multiple Choice)
4.8/5 (35)
Office workers were asked how long it took them to travel to work one morning.Here is the stem-and-leaf display. 2 3 4 5 6 0002344578 0257 12789 028 05 Without actually finding the mean and the median,would you expect the mean to be higher or lower than the median?
(Multiple Choice)
4.8/5 (32)
Members of the Ontario Field Ornithologists (OFO)observe birds at various locations within the province to see how many different species of bird they can spot.Suppose that 21 members have reported spotting the following number of species in 2014.The lower stem contains leaves with the digits 0-4 and the upper stem contains leaves with digits 5-9. Ontario Bird Count Totals 17
17
16
16
15
15
14
14
13
13
12
12
11
11
10
10 8
88
9
02
679
79
11233
89
233 Key:
11 = 117 birds
(Multiple Choice)
4.9/5 (39)
Filters
- Essay(0)
- Multiple Choice(0)
- Short Answer(0)
- True False(0)
- Matching(0)