Exam 2: Displaying and Describing Categorical Data
Exam 1: Stats Starts Here33 Questions
Exam 2: Displaying and Describing Categorical Data70 Questions
Exam 3: Displaying and Summarizing Quantitative Data148 Questions
Exam 4: Understanding and Comparing Distributions46 Questions
Exam 5: The Standard Deviation As a Ruler and the Normal Model111 Questions
Exam 6: Scatterplots, association, and Correlation78 Questions
Exam 7: Linear Regression71 Questions
Exam 8: Regression Wisdom32 Questions
Exam 9: Understanding Randomness26 Questions
Exam 10: Sample Surveys64 Questions
Exam 11: Experiments and Observational Studies80 Questions
Exam 12: From Randomness to Probability69 Questions
Exam 13: Probability Rules95 Questions
Exam 14: Random Variables215 Questions
Exam 15: Sampling Distribution Models51 Questions
Exam 16: Confidence Intervals for Proportions71 Questions
Exam 17: Testing Hypotheses About Proportions44 Questions
Exam 18: More About Tests67 Questions
Exam 19: Comparing Two Proportions53 Questions
Exam 20: Inferences About Means123 Questions
Exam 21: Comparing Means50 Questions
Exam 22: Paired Samples and Blocks35 Questions
Exam 23: Comparing Counts76 Questions
Exam 24: Inferences for Regression57 Questions
Exam 25: Analysis of Variance39 Questions
Exam 26: Multifactor Analysis of Variance22 Questions
Exam 27: Multiple Regression22 Questions
Exam 28: Multiple Regression Wisdom21 Questions
Exam 29: Rank-Based Nonparametric Tests29 Questions
Exam 30: The Bootstrap27 Questions
Select questions type
A survey of university students in Canada reported the following percentages. Cat lover Dog lover Other Total Brand 1 Cola 22.5\% 28.0\% 16.5\% 67.0\% Brand 2 Cola 7.5\% 12.0\% 13.5\% 33.0\% Total 30.0\% 40.0\% 30.0\% 100\% Find the conditional distribution of pet preference for students that prefer Brand 1 Cola.
Free
(Multiple Choice)
4.8/5  (41)
(41)
Correct Answer: Verified
C
Students in a political science course were asked to describe their politics as "Liberal","Moderate",or "Conservative." Here are the results: Politics SEX Liberal Moderate Conservative Total Female 37 25 8 70 Male 41 55 28 124 Total 78 80 36 194 What percent of all males in the class are "Liberals"?
Free
(Multiple Choice)
4.9/5 (36)
Correct Answer:Verified
B
A company must decide which of two delivery services they will contract with.During a recent trial period they shipped numerous packages with each service,and have kept track of how often deliveries did not arrive on time.Here are the data: Delivery service Type of service Number of deliveries Number of late packages Regular 100 3 Super Ship Overnight 400 40 Regular 400 16 Fast Paks Overnight 100 14 Based on the results,the company decided to hire Fast Paks.Do you agree they deliver on time more often? Explain.
Free
(Multiple Choice)
4.8/5 (30)
Correct Answer:Verified
B
Most patients who undergo surgery make routine recoveries and are discharged as planned,but some patients experience complications and their discharge is delayed.A small city has a large hospital and a small hospital,each performing major and minor surgeries.Data is collected at each hospital to see how many surgical patients have their discharges delayed by postsurgical complications.The results are shown in the following table. Discharge Delayed procedure Large hospital Small hospital Major surgery 72 of 600 12 of 60 Minor surgery 12 of 300 20 of 250 What were the discharge delay rates at each hospital?
(Multiple Choice)
4.8/5 (28)
A newspaper surveyed its subscribers as to which section of the paper they read first.The results are listed below. Section Percent Front page 18.3 Sports 25.2 Business 13.9 Comics 22.1 Horoscope 13.7 What percent of subscribers read a section of the paper not listed above first?
(Multiple Choice)
4.8/5 (36)
The Centers for Disease Control in the U.S.A.lists causes of death for individual states in 2002.The mortality data for the five leading causes of death for one state is given. Cause of Death Percent Heart Disease 28.5\% Cancer 23.2\% Circulatory diseases and stroke 7.5\% Respiratory diseases 5.5\% Accidents 4.8\% Which of the following displays is/are appropriate to describe the data for all causes of death? (More than one display may be appropriate.)
I 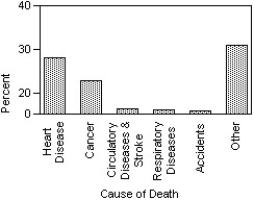 II
II 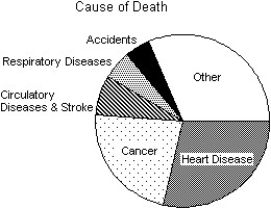 III
III 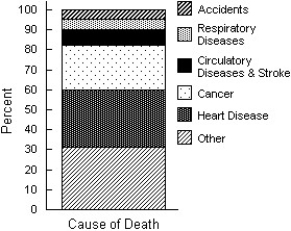
(Multiple Choice)
4.8/5 (42)
A company held a cholesterol screening clinic for its employees.The results are summarized in the table below by age group and cholesterol level.A graphical display of the conditional distributions of cholesterol levels by age is given. age choleserol level Under 30 30-49 Over 50 Low 31 38 24 Borderline 50 96 111 High 18 46 63 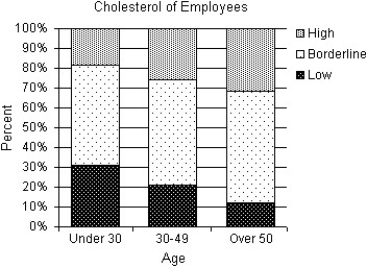 Does this prove that aging causes increased cholesterol levels? Explain.
(Multiple Choice)
4.9/5 (33)
A survey of automobiles parked in student and staff lots at a large university classified the brands by region of origin,as seen in the table. Driver origin Student Staff North American 90 86 European 31 15 Asian 60 52 What percent of the North American cars were owned by staff?
(Multiple Choice)
4.9/5 (37)
A survey of automobiles parked in student and staff lots at a large university classified the brands by region of origin,as seen in the table. Driver origin Student Staff North American 106 94 European 35 25 Asian 65 50 What percent of the foreign cars were owned by students?
(Multiple Choice)
4.7/5 (34)
The focus of a recent survey was on teenagers' familiarity with and use of modern technology.The teenagers were asked if they used each of the following technologies on a daily basis and if the technology was critically important to own.For each question,the percentage of those responding "Yes" is given.Subtracting the "Use daily" percentage from the "Critically important to own" percentage gives the "Importance Gap".Here are the results: Use daily Critically important to own Importance gap Computer 46\% 78\% 32 Telephone 52\% 69\% 17 DVD 39\% 52\% 13 Calculator 71\% 77\% 6 Stereo/audio 90\% 72\% -18 Video games 48\% 21\% -27 Which of the following displays is the most appropriate for these data?
I 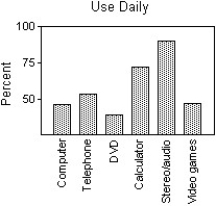 II
II 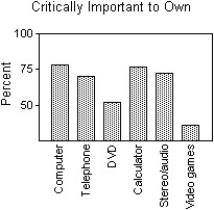 III
III 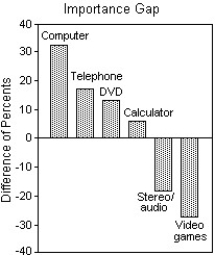
(Multiple Choice)
4.9/5 (28)
An article in a magazine examined the graduate admissions process at a university for evidence of gender bias.The table below shows the number of applicants accepted to each of four graduate programs. Students Accepted program Males accepted (of applicants) Females accepted (of applicants) 1 431 of 692 77 of 93 2 268 of 414 27 of 36 3 130 of 375 124 of 341 4 14 of 233 17 of 205 Total 843 of 1714 245 of 675 After reading this article,a classmate claims that there is gender bias because the university clearly accepted more males than females.Do you agree with your classmate? Explain.
(Multiple Choice)
4.8/5 (37)
Students in a political science course were asked to describe their politics as "Liberal","Moderate",or "Conservative." Here are the results: Politics SEX Liberal Moderate Conservative Total Female 41 31 7 79 Male 43 37 20 100 Total 84 68 27 179 What percent of all students in the class are males who consider themselves to be "Liberal"?
(Multiple Choice)
4.9/5 (34)
A survey of automobiles parked in student and staff lots at a large university classified the brands by country of origin.The results are listed in the table below. driver origin Student Staff North American 101 79 European 33 51 Asian 68 29 Create a segmented bar graph which shows the conditional distributions of origin for both students and staff.
(Essay)
4.7/5 (36)
Students in a political science course were asked to describe their politics as "Liberal","Moderate",or "Conservative." Here are the results: Politics SEX Liberal Moderate Conservative Total Female 27 31 13 71 Male 42 38 24 104 Total 69 69 37 175 What percent of all "Moderates" in the class are male?
(Multiple Choice)
4.8/5 (32)
A survey of automobiles parked in student and staff lots at a large university classified the brands by country of origin,as seen in the table.
Origin Student Staff North American 100 90 European 32 24 Asian 58 57 What is the conditional distribution of origin for students?
(Multiple Choice)
4.8/5 (37)
Most patients who undergo surgery make routine recoveries and are discharged as planned,but some patients experience complications and their discharge is delayed.A small city has a large hospital and a small hospital,each performing major and minor surgeries.Data is collected at each hospital to see how many surgical patients have their discharges delayed by postsurgical complications.The results are shown in the following table. Discharge Delayed procedure Large hospital Small hospital Major surgery 120 of 1000 20 of 80 Minor surgery 16 of 400 12 of 150 What were the discharge delay rates for each kind of surgery?
(Multiple Choice)
4.8/5 (34)
A survey of salesmen was conducted to examine the possibility of a relationship between men's height and annual income.The company interested in the results of the survey believes that taller men are more successful at getting sales,resulting in a higher annual income.The table shows the percentages of income levels for each height category.A graphical display of the conditional distributions of income levels by height is given. height income Under 5'4" -5 -11" Over 1 Under \ 35,000 12\% 13\% 13\% 6\% \ 35,000-\ 49,999 21\% 21\% 20\% 20\% \ 50,000-\ 69,999 23\% 22\% 23\% 23\% \ 70,000-\ 99,999 24\% 24\% 25\% 24\% \ 100,000 and over 20\% 20\% 19\% 27\% Total 100 100 100 100 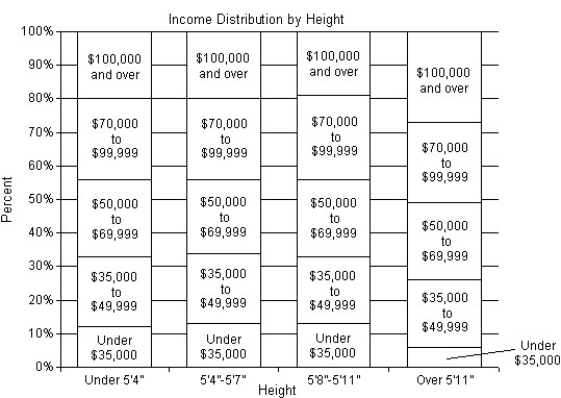 Do these data support the company's belief: taller men are more successful salesmen? Explain.
(Multiple Choice)
4.8/5 (39)
Most patients who undergo surgery make routine recoveries and are discharged as planned,but some patients experience complications and their discharge is delayed.A small city has a large hospital and a small hospital,each performing major and minor surgeries.Data is collected at each hospital to see how many surgical patients have their discharges delayed by postsurgical complications.The results are shown in the following table. Discharge Delayed procedure Large hospital Small hospital Major surgery 60 of 600 8 of 40 Minor surgery 4 of 100 12 of 150 Overall,for what percent of surgical patients was discharge delayed?
(Multiple Choice)
4.9/5 (27)
A survey of university students in Canada reported the following percentages. Cat lover Dog lover Other Total Brand 1 Cola 22.5\% 28.0\% 16.5\% 67.0\% Brand 2 Cola 7.5\% 12.0\% 13.5\% 33.0\% Total 30.0\% 40.0\% 30.0\% 100\% Find the marginal distribution of pet preference.
(Multiple Choice)
4.9/5 (34)
A college examined the impact of an applicant's ethnicity on the likelihood of admission to a particular program.The data are summarized in the table below. Admission Decision EHTNICITY Accepted Wait-listed Tumed away Total Black/Hisparic 456 0 38 494 Asian 91 60 137 288 White 329 245 372 946 Total 876 305 547 1728 What percent of accepted applicants were Black or Hispanic?
(Multiple Choice)
4.8/5 (32)
Filters
- Essay(0)
- Multiple Choice(0)
- Short Answer(0)
- True False(0)
- Matching(0)