Exam 4: Understanding and Comparing Distributions
Exam 1: Stats Starts Here33 Questions
Exam 2: Displaying and Describing Categorical Data70 Questions
Exam 3: Displaying and Summarizing Quantitative Data148 Questions
Exam 4: Understanding and Comparing Distributions46 Questions
Exam 5: The Standard Deviation As a Ruler and the Normal Model111 Questions
Exam 6: Scatterplots, association, and Correlation78 Questions
Exam 7: Linear Regression71 Questions
Exam 8: Regression Wisdom32 Questions
Exam 9: Understanding Randomness26 Questions
Exam 10: Sample Surveys64 Questions
Exam 11: Experiments and Observational Studies80 Questions
Exam 12: From Randomness to Probability69 Questions
Exam 13: Probability Rules95 Questions
Exam 14: Random Variables215 Questions
Exam 15: Sampling Distribution Models51 Questions
Exam 16: Confidence Intervals for Proportions71 Questions
Exam 17: Testing Hypotheses About Proportions44 Questions
Exam 18: More About Tests67 Questions
Exam 19: Comparing Two Proportions53 Questions
Exam 20: Inferences About Means123 Questions
Exam 21: Comparing Means50 Questions
Exam 22: Paired Samples and Blocks35 Questions
Exam 23: Comparing Counts76 Questions
Exam 24: Inferences for Regression57 Questions
Exam 25: Analysis of Variance39 Questions
Exam 26: Multifactor Analysis of Variance22 Questions
Exam 27: Multiple Regression22 Questions
Exam 28: Multiple Regression Wisdom21 Questions
Exam 29: Rank-Based Nonparametric Tests29 Questions
Exam 30: The Bootstrap27 Questions
Select questions type
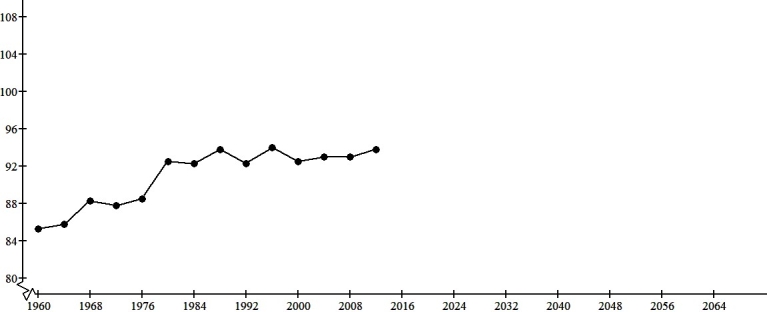
Use the Olympic gold medal performances in the men's high jump from the years 1960-2012 to construct a timeplot. Year High Jump (in.) 1960 85.25 1964 85.75 1968 88.25 1972 87.75 1976 88.50 1980 92.50 1984 92.50 1988 93.75 1992 92.25 1996 94.00 2000 92.50 2004 93.00 2008 93.00 2012 93.75
Free
(Essay)
4.7/5  (35)
(35)
Correct Answer: Verified
 Year
Year
Here are boxplots of the points scored during the first 10 games of the basketball season for both Caroline and Alexandra.The coach can take only one player to the state championship.Which one should she take knowing that she would like a safe player? 
Free
(Multiple Choice)
4.9/5 (38)
Correct Answer:Verified
C
The following stem-and-leaf display shows the number of homeless cats and dogs that had to be euthanized each year in a large city for the period 1985-2004.Use both the stemplot and timeplot to describe the distribution. Euthanized Animal Totals 90
89
88
87
86
85
84
83
82
81 0 3 4449 057 6 1157 001338 \ Key:
cats and dogs euthanized 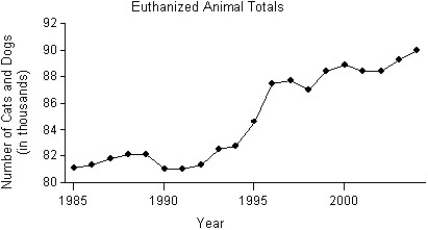
Free
(Multiple Choice)
4.8/5 (40)
Correct Answer:Verified
C
Use the high closing values of Naristar Inc.stock from the years 2003-2014 to construct a timeplot. Year High Year High 2003 42 2009 47 2004 40 2010 60 2005 31 2011 61 2006 42 2012 57 2007 44 2013 54 2008 47 2014 30
(Essay)
5.0/5 (38)
Use the high closing values of Naristar Inc.stock from the years 2003-2014 to construct a timeplot. Year High Year High 2003 48 2009 62 2004 53 2010 60 2005 47 2011 68 2006 55 2012 42 2007 58 2013 51 2008 61 2014 78
(Essay)
4.9/5 (34)
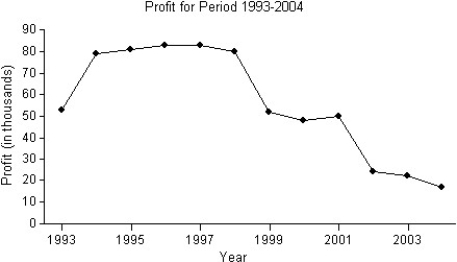
A business owner recorded her annual profits for the first 12 years since opening her business in 1993.The stem-and-leaf display below shows the annual profits in thousands of dollars.Use both the stemplot and timeplot to describe the distribution. Annual Profit Totals 8
7
6
5
4
3
2
1 0133 9 023 8 24 7 Key:
(Multiple Choice)
4.8/5 (35)
The histograms display the body fat percentages of 42 female students and 48 male students taking a college health course. 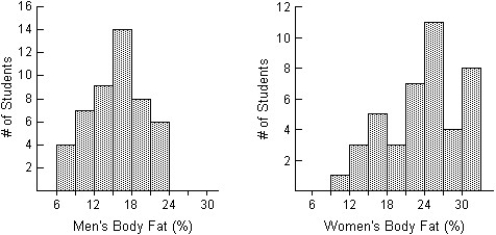 Compare the distributions (shape,centre,spread,unusual features).
(Multiple Choice)
4.8/5 (30)
The reaction time of 20 drivers at a stop light was measured,in seconds,as the time between the traffic light turning green and the time it took them to press the gas pedal. 0.4 1.0 1.5 1.6 2.0
2.2 2.4 2.7 3.4 3.4
3.5 3.6 3.6 3.7 3.7
3.9 4.1 4.2 4.2 7.0
(Multiple Choice)
4.9/5 (36)
Here are the heights,in centimetres,of 32 Grade 3 students. 100 100 105 105 106 106 107 107
108 110 110 112 112 112 114 114
114 115 116 117 118 118 118 118
118 119 120 121 122 125 128 142
(Multiple Choice)
4.8/5 (30)
Describe what these boxplots tell you about the relationship between the provinces and salary,based on the same occupation. 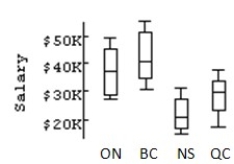
(Multiple Choice)
4.8/5 (28)
The times,in minutes,it took for 21 students to finish writing a statistics test are given below. 32.4 30.5 34.6 64.9 22.1 31.8 16.6
27.7 36.2 60.6 24.3 47.2 45.6 9.2
27.1 18.9 14.2 31.4 24.2 12.5 35.4
(Multiple Choice)
4.9/5 (35)
Here are 3 boxplots of weekly gas prices at a service station in the U.S.A.(price in $ per gallon).Compare the distribution of prices over the three years. 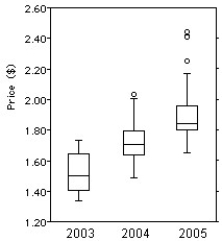
(Multiple Choice)
4.8/5 (37)
The boxplots display case prices (in dollars)of white wines produced by three vineyards in south-western Ontario.Which vineyard produces the cheapest wine? 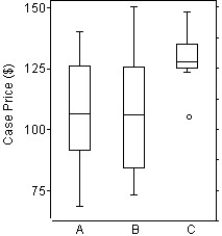
(Multiple Choice)
4.9/5 (32)
The ages of the 21 members of a track and field team are listed below. 15 18 18 19 22 23 24
24 24 25 25 26 26 27
28 28 30 32 33 40 42
(Multiple Choice)
4.8/5 (35)
The boxplots display case prices (in dollars)of white wines produced by three vineyards in south-western Ontario.In which vineyard are the wines generally more expensive? 
(Multiple Choice)
4.8/5 (38)
The back-to-back stem-and-leaf display compares the percent growth in sales for a retail chain's stores located in two regions of Canada.The lower stem contains leaves with the digits 0-4 and the upper stem contains leaves with digits 5-9. Region 1 Stores 211000 998876655555 444433 6 6 5 5 4 4 3 3 2 2 1 1 0 0 Region 2 Stores 5 8 556 34 67 233 55567 024444 56 444 Key: 3 = 35% sales growth
(Multiple Choice)
4.9/5 (30)
The back-to-back stem-and-leaf display compares the annual precipitation,in millimetres,of two towns over a period of 14 years.The lower stem contains leaves with the digits 0-4 and the upper stem contains leaves with digits 5-9. Town1 3 \ 1 55 4443 0 9887 4 24 24 23 23 22 22 21 21 20 20 19 19 18 18 Town2 \ 5 24 5667 4 57789 2 Key: 20 = 20.7 millimetres
(Multiple Choice)
4.8/5 (33)
Filters
- Essay(0)
- Multiple Choice(0)
- Short Answer(0)
- True False(0)
- Matching(0)