Exam 24: Inferences for Regression
Exam 1: Stats Starts Here33 Questions
Exam 2: Displaying and Describing Categorical Data70 Questions
Exam 3: Displaying and Summarizing Quantitative Data148 Questions
Exam 4: Understanding and Comparing Distributions46 Questions
Exam 5: The Standard Deviation As a Ruler and the Normal Model111 Questions
Exam 6: Scatterplots, association, and Correlation78 Questions
Exam 7: Linear Regression71 Questions
Exam 8: Regression Wisdom32 Questions
Exam 9: Understanding Randomness26 Questions
Exam 10: Sample Surveys64 Questions
Exam 11: Experiments and Observational Studies80 Questions
Exam 12: From Randomness to Probability69 Questions
Exam 13: Probability Rules95 Questions
Exam 14: Random Variables215 Questions
Exam 15: Sampling Distribution Models51 Questions
Exam 16: Confidence Intervals for Proportions71 Questions
Exam 17: Testing Hypotheses About Proportions44 Questions
Exam 18: More About Tests67 Questions
Exam 19: Comparing Two Proportions53 Questions
Exam 20: Inferences About Means123 Questions
Exam 21: Comparing Means50 Questions
Exam 22: Paired Samples and Blocks35 Questions
Exam 23: Comparing Counts76 Questions
Exam 24: Inferences for Regression57 Questions
Exam 25: Analysis of Variance39 Questions
Exam 26: Multifactor Analysis of Variance22 Questions
Exam 27: Multiple Regression22 Questions
Exam 28: Multiple Regression Wisdom21 Questions
Exam 29: Rank-Based Nonparametric Tests29 Questions
Exam 30: The Bootstrap27 Questions
Select questions type
The index of exposure to radioactive waste and the cancer mortality rates (deaths per 100,000)were recorded for nine different geographic regions.A 99% confidence interval for the slope of the regression line was determined to be (4.27,14.20).Give an interpretation of this interval. Dependent variable is: Cancer Mortality Rate
R-squared = 85.8%
S = 14.00993 with 9 - 2 = 7 degrees of freedom Variable Coefficient SE(Coeff) t-ratio P-value Constant 114.7156 8.045663 14.25807 0.00000198 Index of Exp 9.231456 1.418787 6.506584 0.000332
(Multiple Choice)
4.9/5  (33)
(33)
Consider a logistic regression model for the probability of a "success",given a quantitative variable X. Term Estimate Intercept -4.00 0.10 Use the output above to estimate the odds in favour of a success when X = 25.
(Multiple Choice)
4.9/5 (36)
A grass seed company conducts a study to determine the relationship between the density of seeds planted (in pounds per 500 sq ft)and the quality of the resulting lawn.Eight similar plots of land are selected and each is planted with a particular density of seed.One month later the quality of each lawn is rated on a scale of 0 to 100.The regression analysis and summary statistics are given below.Determine a 99% prediction interval for the lawn quality of a lawn sown with a seed density of 1.3. Variable Count Mean StdDev Range Seed Density 8 2.75 0.49099 4 Lawn Quality 8 45.625 3.712611 35 Dependent variable is: Lawn Quality R-squared = 36.0%
S = 9.073602 with 8 - 2 = 6 degrees of freedom Variable Coefficient SE(Coeff) t-ratio P-value Constant 33.14815 7.510757 4.413423 0.004503 Seed Density 4.537037 2.469522 1.837213 0.115825
(Multiple Choice)
4.8/5 (46)
In the context of regression analysis,explain what is meant by the term "residual".
(Essay)
4.9/5 (32)
The typing speeds (in words per minute)and reading speeds (in words per minute)of nine randomly selected secretaries were recorded.Use the regression analysis provided below to find a 90% confidence interval for the slope of the regression line. Dependent variable is: Reading speed
R-squared = 12.385%
S = 100.3348 with 9 - 2 = 7 degrees of freedom Variable Coefficient SE(Coeff) t-ratio P-value Constant 290.2093 215.4116 1.347231 0.219884 Typing speed 3.502052 3.520579 0.994737 0.352998
(Multiple Choice)
4.8/5 (37)
The sample data below are the index of exposure to radioactive waste for nine different geographic regions and cancer mortality rates (deaths per 100,000). Index of Exposure Cancer Mortality Rate 2.49 147.1 2.57 130.1 3.41 129.9 1.25 113.5 1.62 137.5 3.83 162.3 11.64 207.5 6.41 177.9 8.34 210.3 Using a 1% level of significance,do the data below support the claim that a higher index of exposure is associated with a higher cancer mortality rate?
(Essay)
4.9/5 (31)
Ten students in a graduate program at the University of Toronto were randomly selected.Their grade point averages (GPAs)when they entered the program were between 3.5 and 4.0.The following data consist of the students' GPAs on entering the program and their current GPAs. Entering GPA Current GPA 3.5 3.6 3.8 3.7 3.6 3.9 3.6 3.6 3.5 3.9 3.9 3.8 4.0 3.7 3.9 3.9 3.5 3.8 3.7 4.0 Using a 10% level of significance,do the data below provide evidence of the conclusion that higher entering GPAs are associated with higher current GPAs?
(Essay)
4.8/5 (23)
Applicants for a particular job,which involves extensive travel in Spanish-speaking countries,must take a proficiency test in Spanish.The sample data below were obtained in a study of the relationship between the numbers of years applicants have studied Spanish and their score on the test. Number of years Score 3 57 4 78 4 72 2 58 5 89 3 63 4 73 5 84 3 75 2 48 Using a 1% level of significance,do the data provide sufficient evidence to conclude that the slope of the regression line is not 0 and hence that number of years of study is useful as a predictor of score on the test?
(Essay)
4.9/5 (33)
Decide whether or not the conditions and assumptions for regression inference are satisfied. Explain your answer.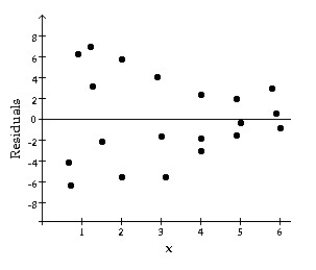
(Essay)
4.7/5 (46)
The index of exposure to radioactive waste and the cancer mortality rates (deaths per 100,000)were recorded for nine different geographic regions.A 95% prediction interval for the cancer mortality rate of a region whose index of exposure is 5.79 is 133.0 to 203.4 deaths per 100,000. Variable Count Mean StdDev Range Index of Exp 9 4.617778 1.163731 10.39 Cancer Mortality Rate 9 157.3444 11.59712 96.8 Dependent variable is: Cancer Mortality Rate R-squared = 85.8%
S = 14.00993 with 9 - 2 = 7 degrees of freedom Variable Coefficient SE(Coeff) t-ratio P-value Constant 114.7156 8.045663 14.25807 0.00000198 Index of Exp 9.231456 1.418787 6.506584 0.000332
(Multiple Choice)
4.9/5 (39)
The index of exposure to radioactive waste and the cancer mortality rates (deaths per 100,000)were recorded for nine different geographic regions.Using a 1% level of significance,use the regression analysis provided below to perform the hypothesis test to determine if the index of exposure is useful as a predictor or cancer mortality rate.
Dependent variable is: Cancer Mortality Rate
R-squared = 85.8%
s = 14.00993 with 9 - 2 = 7 degrees of freedom Variable Coefficient SE(Coeff) t-ratio P-value Constant 114.7156 8.045663 14.25807 0.00000198 Index of Exp 9.231456 1.418787 6.506584 0.000332
(Essay)
4.8/5 (38)
The typing speeds (in words per minute)and reading speeds (in words per minute)of nine randomly selected secretaries were recorded.Using a 10% level of significance,carry out a test to determine if the linear correlation is greater than 0.The regression analysis is given below.
Dependent variable is: Reading speed
R-squared = 12.385%
s = 100.3348 with 9 - 2 = 7 degrees of freedom
(Essay)
4.9/5 (31)
A Regression Model
Decide whether or not the conditions and assumptions for regression inference are satisfied. Explain your answer.
-
(Essay)
4.8/5 (31)
Ten students in a graduate program were randomly selected.Their grade point averages (GPAs)when they entered the program were between 3.5 and 4.0.The students' GPAs on entering the program and their current GPAs were recorded.Using a 10% level of significance,do the data below provide evidence of the conclusion that higher entering GPAs are associated with higher current GPA?
Dependent variable is: Current GPA
R-squared = 0.001849
s = 0.1452 with 10 - 2 = 8 degrees of freedom Variable Coefficient SE(Coeff) t-ratio P-value Constant 3.674375 0.95089 3.864144 0.004781 Entering GPA 0.03125 0.256697 0.121739 0.4531
(Essay)
4.9/5 (38)
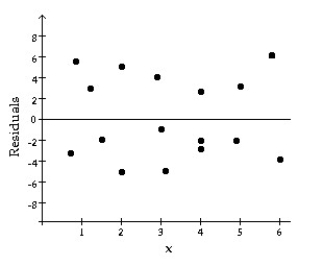
Decide whether or not the conditions and assumptions for regression inference are satisfied. Explain your answer.
-
(Essay)
5.0/5 (39)
The index of exposure to radioactive waste and the cancer mortality rates (deaths per 100,000)were recorded for nine different geographic regions.A 95% confidence interval for the mean cancer mortality rate of all regions whose index of exposure is 6.57 was determined to be (162.5,188.2). Variable Count Mean StdDev Range Index of Exp 9 4.617778 1.163731 10.39 Cancer Mortality Rate 9 157.3444 11.59712 96.8 Dependent variable is: Cancer Mortality Rate R-squared = 85.8%
S = 14.00993 with 9 - 2 = 7 degrees of freedom Variable Coefficient SE(Coeff) t-ratio P-value Constant 114.7156 8.045663 14.25807 0.00000198 Index of Exp 9.231456 1.418787 6.506584 0.000332
(Multiple Choice)
4.9/5 (42)
The index of exposure to radioactive waste and the cancer mortality rates (deaths per 100,000)were recorded for nine different geographic regions.Use the regression analysis and summary statistics provided below to determine a 95% confidence interval for the average cancer mortality rate of a county whose index of exposure is 6.81 Variable Count Mean StdDev Range Index of Exp 9 4.617778 1.163731 10.39 Cancer Mortality Rate 9 157.3444 11.59712 96.8 Dependent variable is: Cancer Mortality Rate R-squared = 85.8%
S = 14.00993 with 9 - 2 = 7 degrees of freedom Variable Coefficient SE(Coeff) t-ratio P-value Constant 114.7156 8.045663 14.25807 0.00000198 Index of Exp 9.231456 1.418787 6.506584 0.000332
(Multiple Choice)
4.9/5 (44)
Filters
- Essay(0)
- Multiple Choice(0)
- Short Answer(0)
- True False(0)
- Matching(0)