Exam 2: Displaying and Describing Categorical Data
Exam 1: Stats Starts Here33 Questions
Exam 2: Displaying and Describing Categorical Data70 Questions
Exam 3: Displaying and Summarizing Quantitative Data148 Questions
Exam 4: Understanding and Comparing Distributions46 Questions
Exam 5: The Standard Deviation As a Ruler and the Normal Model111 Questions
Exam 6: Scatterplots, association, and Correlation78 Questions
Exam 7: Linear Regression71 Questions
Exam 8: Regression Wisdom32 Questions
Exam 9: Understanding Randomness26 Questions
Exam 10: Sample Surveys64 Questions
Exam 11: Experiments and Observational Studies80 Questions
Exam 12: From Randomness to Probability69 Questions
Exam 13: Probability Rules95 Questions
Exam 14: Random Variables215 Questions
Exam 15: Sampling Distribution Models51 Questions
Exam 16: Confidence Intervals for Proportions71 Questions
Exam 17: Testing Hypotheses About Proportions44 Questions
Exam 18: More About Tests67 Questions
Exam 19: Comparing Two Proportions53 Questions
Exam 20: Inferences About Means123 Questions
Exam 21: Comparing Means50 Questions
Exam 22: Paired Samples and Blocks35 Questions
Exam 23: Comparing Counts76 Questions
Exam 24: Inferences for Regression57 Questions
Exam 25: Analysis of Variance39 Questions
Exam 26: Multifactor Analysis of Variance22 Questions
Exam 27: Multiple Regression22 Questions
Exam 28: Multiple Regression Wisdom21 Questions
Exam 29: Rank-Based Nonparametric Tests29 Questions
Exam 30: The Bootstrap27 Questions
Select questions type
Students in a Political Science course were asked to describe their politics as "Liberal","Moderate",or "Conservative." The results are listed in the table below. Politics sex Liberal Moderate Conservative Total Female 45 49 8 102 § 64 53 29 146 Male 64 102 37 248 Total 109 148 Create a segmented bar graph which shows the conditional distributions by gender for each political category.
(Essay)
4.7/5  (34)
(34)
The table compares what students at a Canadian college did after graduating in 1992,1998,and 2003. year plans 1992 1998 2003 Continuing education 436 582 772 Employed 679 758 801 In the military 78 60 51 Other 52 92 87 Create a segmented bar graph which shows the conditional distributions of plans for each of the three years.
(Essay)
4.7/5 (39)
The City of Windsor Department of Parks and Recreation is planning to build a recreation centre in one of the city's parks.They conducted a poll to find out the types of physical activities the local population would be interested in.The poll was based on telephone responses from 1013 randomly selected adults.The table shows the percentages of people who expressed interest in various activities. Activity Percent Running/Walking 56 Weight Training 48 Biking 33 Aerobics 25 Swimming 13 Create a bar chart for these data.
(Essay)
4.8/5 (45)
A college examined the impact of an applicant's ethnicity on the likelihood of admission to a particular program.The data are summarized in the table below. Admission Decision EHTNICITY Accepted Wait-listed Tumed away Total Black/Hispanic 457 0 23 480 Asian 109 56 137 302 White 317 264 348 929 Total 883 320 508 1711 What percent of Asian applicants were wait-listed?
(Multiple Choice)
4.8/5 (36)
From a sample of individuals the following percentages are reported:
- 22% of the individuals said they drink beer and wine.
- 12% of the individuals said they drink neither beer nor wine.
- 35% of the individuals said they drink beer.
Create a contingency table with percentages describing the relationship between beer and wine drinkers.
(Essay)
4.7/5 (38)
At a university in the U.S.A.,the incoming freshmen were surveyed about their chosen majors.The university organized the data by placing the majors into the appropriate colleges.The table displays the results for males and females by colleges.A graphical display of the conditional distributions of colleges by gender is given. Gender college Male Female College of Liberal Arts and Sciences 1809 1918 College of Business 905 804 College of Education 312 247 College of Visual and Performing Arts 94 124 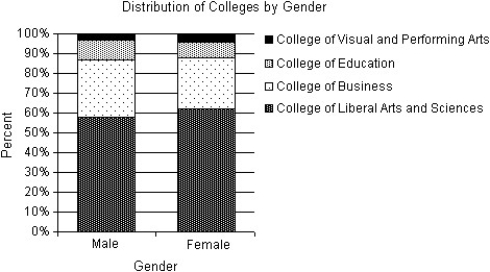 Do you think that the college the freshmen will be entering is independent of the gender of the student? Explain.
(Multiple Choice)
4.9/5 (38)
A poll asked adults which activities they had engaged in during the past month.The results are listed below. Activity Percent Dinner out 55.7 Sporting event 15.9 Movie 45.6 Stroll 5.1 Is it reasonable to conclude that 61.5% of those polled had seen a movie or gone to a sporting event during the past month?
(Multiple Choice)
4.8/5 (43)
The table below compares what students at a small Canadian university did after graduating with a bachelor's degree in 1992,1998,and 2003.A graphical display of the conditional distributions of what students did after graduation by year is given. year plans 1992 1998 2003 Continuing education 436 582 772 Employed 679 758 801 In the military 78 60 51 Other 52 92 87 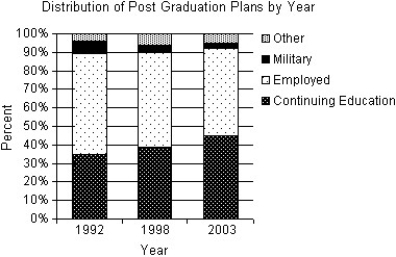 Does this study present any evidence that postgraduation plans have changed over this 11-year period? Explain.
(Multiple Choice)
4.9/5 (41)
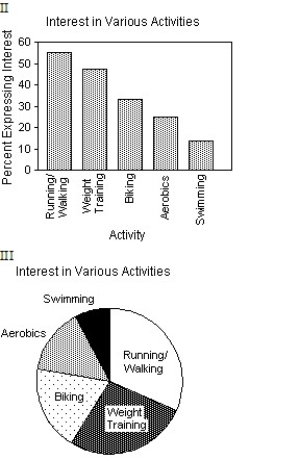
The City of Windsor Department of Parks and Recreation is planning to build a recreation centre in one of the city's parks.They conducted a poll to find out which of five types of physical activities the local population would be interested in.The poll was based on telephone responses from 1013 randomly selected adults.The table shows the percentages of people who expressed interest in various activities. Activity Percent Running/Walking 56\% Weight Training 48\% Biking 33\% Aerobics 25\% Swimming 13\% Which of the following displays is/are appropriate to describe the data for these five activities? (More than one display may be appropriate.) 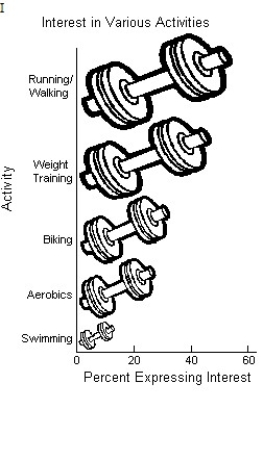
(Multiple Choice)
4.9/5 (40)
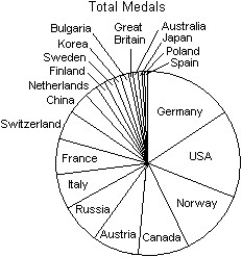
A prediction of the number of medals to be won by various countries in the 2014 Winter Olympics was made using past Olympics data.The predicted values are listed in the table below. Country Medals Germany 37 USA 36 Norway 27 Canada 24 Austria 16 Russia 16 Italy 15 France 15 Switzerland 13 China 10 Country Medals Netherlands 5 Finland 4 Sweden 4 Korea 3 Bulgaria 3 Great Britain 2 Australia 2 Japan 2 Poland 1 Spain 1 Which of the following displays is the most appropriate for these data?
I 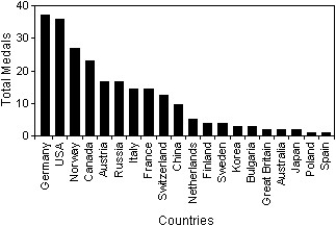 II
II 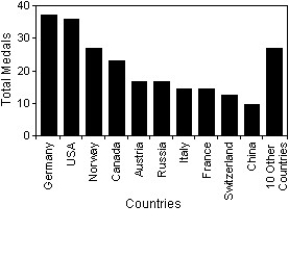 III
III
(Multiple Choice)
4.9/5 (33)
A survey of automobiles parked in student and staff lots at a large university classified the brands by region of origin,as seen in the table. Driver origin Student Staff North American 102 99 European 30 17 Asian 61 51 What percent of all the cars surveyed were foreign (not North American)?
(Multiple Choice)
4.8/5 (42)
A survey of automobiles parked in student and staff lots at a large university classified the brands by region of origin,as seen in the table. Driver origin Student Staff North American 107 91 European 30 21 Asian 63 57 What percent of the staff owned North American cars?
(Multiple Choice)
4.9/5 (41)
Of the 1470 applicants to a college program,760 were accepted,269 were wait-listed,and 441 were turned away for lack of space.Find the relative frequency distribution of the decisions made,and write a sentence describing it.
(Multiple Choice)
4.8/5 (32)
The City of Windsor Department of Parks and Recreation is planning to build a recreation centre in one of the city's parks.They conducted a poll to find out which of five types of physical activities the local population would be interested in.The poll was based on telephone responses from 1013 randomly selected adults.The table shows the percentages of people who expressed interest in various activities. Activity Percent Running/Walking 56\% Weight Training 48\% Biking 33\% Aerobics 25\% Swimming 13\% Which of the following displays is/are appropriate to describe the data for these five activities? (More than one display may be appropriate.)
I 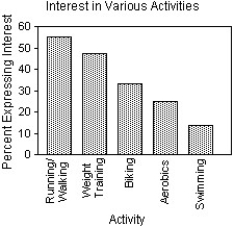 II
II 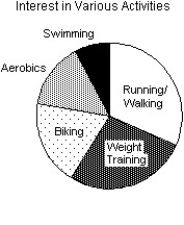 III
III 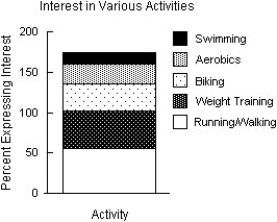
(Multiple Choice)
4.8/5 (33)
Statistics Canada gives the following mortality data for Canada in 2011. Cause of Death Percent Cancer 29.9 Heart disease 19.7 Stroke 5.5 Respiratory diseases 4.6 Accidents 4.4 What percent of deaths were from causes not listed here?
(Multiple Choice)
4.8/5 (37)
Just how accurate are the weather forecasts we hear every day? The table below compares the daily forecast with a city's actual weather for a year. Actual Weather forecast Rain No rain Rain 34 54 No rain 8 269 On what percent of days was rain predicted?
(Multiple Choice)
4.8/5 (41)
Of the 1606 applicants to a college program,456 were Black or Hispanic,300 were Asian,and 850 were White.Summarize the relative frequency distribution of ethnicity with a sentence or two in the proper context.
(Multiple Choice)
4.8/5 (40)
Statistics Canada gives the following mortality data for Canada in 2007. Cause of Death Percent Cancer 29.6 Heart disease 21.5 Stroke 5.9 Respiratory diseases 4.5 Accidents 4.2 Create a bar chart to display the mortality percentages for all causes in Canada in 2007.
(Essay)
4.8/5 (30)
A survey of automobiles parked in student and staff lots at a large university classified the brands by country of origin.The results are listed in the table below,and a graphical display of the conditional distributions of origin by driver is given. Driver origin Student Staff North American 101 79 European 33 51 Asian 68 29 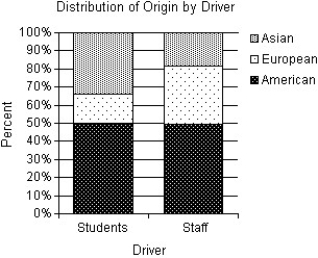 Do you think that origin of the car is independent of the type of driver? Explain.
(Multiple Choice)
4.7/5 (40)
The Centers for Disease Control in the U.S.A.lists causes of death for individual states in 2002.The mortality data for the five leading causes of death for one state is given. Cause of Death Percent Heart Disease 28.5\% Cancer 23.2\% Circulatory diseases and stroke 7.5\% Respiratory diseases 5.5\% Accidents 4.8\% Which of the following displays is/are appropriate to describe the data for all causes of death? (More than one display may be appropriate.)
I 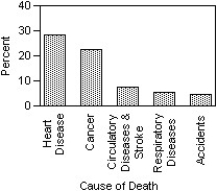 II
II
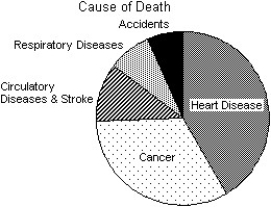 III
III 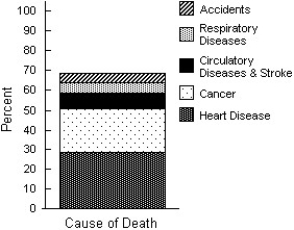
(Multiple Choice)
4.9/5 (30)
Filters
- Essay(0)
- Multiple Choice(0)
- Short Answer(0)
- True False(0)
- Matching(0)