Exam 2: Displaying and Describing Categorical Data
Exam 1: Stats Starts Here33 Questions
Exam 2: Displaying and Describing Categorical Data70 Questions
Exam 3: Displaying and Summarizing Quantitative Data148 Questions
Exam 4: Understanding and Comparing Distributions46 Questions
Exam 5: The Standard Deviation As a Ruler and the Normal Model111 Questions
Exam 6: Scatterplots, association, and Correlation78 Questions
Exam 7: Linear Regression71 Questions
Exam 8: Regression Wisdom32 Questions
Exam 9: Understanding Randomness26 Questions
Exam 10: Sample Surveys64 Questions
Exam 11: Experiments and Observational Studies80 Questions
Exam 12: From Randomness to Probability69 Questions
Exam 13: Probability Rules95 Questions
Exam 14: Random Variables215 Questions
Exam 15: Sampling Distribution Models51 Questions
Exam 16: Confidence Intervals for Proportions71 Questions
Exam 17: Testing Hypotheses About Proportions44 Questions
Exam 18: More About Tests67 Questions
Exam 19: Comparing Two Proportions53 Questions
Exam 20: Inferences About Means123 Questions
Exam 21: Comparing Means50 Questions
Exam 22: Paired Samples and Blocks35 Questions
Exam 23: Comparing Counts76 Questions
Exam 24: Inferences for Regression57 Questions
Exam 25: Analysis of Variance39 Questions
Exam 26: Multifactor Analysis of Variance22 Questions
Exam 27: Multiple Regression22 Questions
Exam 28: Multiple Regression Wisdom21 Questions
Exam 29: Rank-Based Nonparametric Tests29 Questions
Exam 30: The Bootstrap27 Questions
Select questions type
Just how accurate are the weather forecasts we hear every day? The table below compares the daily forecast with a city's actual weather for a year. Forecast Actual Weather Rain No rain Rain 32 55 No rain 10 268 On what percent of days did it actually rain?
(Multiple Choice)
4.9/5  (34)
(34)
Students in a political science course were asked to describe their politics as "Liberal","Moderate",or "Conservative." Here are the results: Sex Politics Liberal Moderate Conservative Total Female 30 42 11 83 Male 41 47 23 111 Total 71 89 34 194 What percent of the class considers themselves to be "Liberal"?
(Multiple Choice)
4.9/5 (43)
The Centers for Disease Control in the U.S.A.lists causes of death for individual states in 2002.The mortality data for the five leading causes of death for one state is given. Cause of Death Percent Heart Disease 28.5\% Cancer 23.2\% Circulatory diseases and stroke 7.5\% Respiratory diseases 5.5\% Accidents 4.8\% Which of the following displays is/are appropriate to describe the data for all causes of death? (More than one display may be appropriate.)
I 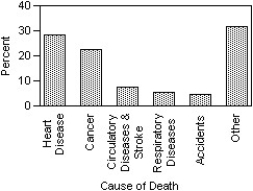 II
II
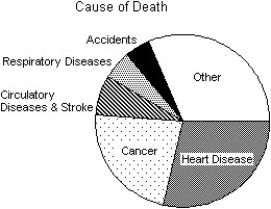 III
III 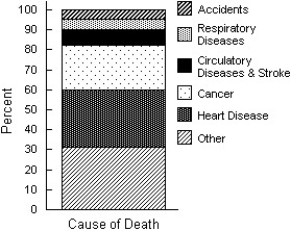
(Multiple Choice)
4.7/5 (44)
A company held a blood pressure screening clinic for its employees.The results are summarized in the table below by age group and blood pressure level. AGE BLOOD PRESSURE Under 30 30-49 Over 49 Low 26 40 38 Normal 45 94 89 High 23 53 73 Find the conditional distribution of blood pressure level for employees over 49.
(Multiple Choice)
4.8/5 (28)
Students in a Political Science course were asked to describe their politics as "Liberal","Moderate",or "Conservative." Here are the results: Sex Politics Liberal Moderate Conservative Total Female 45 49 12 106 Male 64 53 25 142 Total 109 102 37 248 Which graphical display shows the marginal distribution of politics in the class?
I 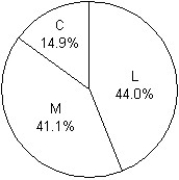 II
II 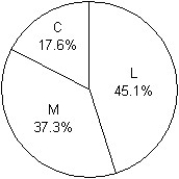 III
III 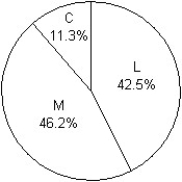
(Multiple Choice)
4.8/5 (36)
Students in a Political Science course were asked to describe their politics as "Liberal","Moderate",or "Conservative." Here are the results: Sex Politics Liberal Moderate Conservative Total Female 45 49 12 106 Male 64 53 25 142 Total 109 102 37 248 Produce a pie chart that shows the conditional distribution of politics among the males.
(Essay)
4.8/5 (37)
Students in a political science course were asked to describe their politics as "Liberal","Moderate",or "Conservative." The results are listed in the table below,and a graphical display of the conditional distributions of sex among the three categories of politics is given. Politics sex Liberal Moderate Conservative Total Female 45 49 8 102 64 53 29 146 Male 64 102 37 248 Total 109 148 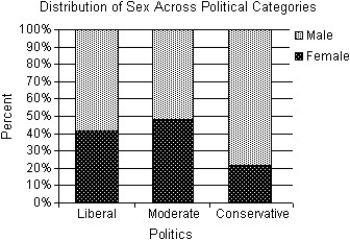 The political science instructor states that sex and politics are independent.Is this an accurate statement? Explain.
(Multiple Choice)
4.8/5 (33)
A company held a blood pressure screening clinic for its employees.The results are summarized in the table below by age group and blood pressure level. AGE BLOOD PRESSURE Under 30 30-49 Over 49 Low 29 38 32 Normal 46 86 89 High 16 60 68 Find the marginal distribution of blood pressure level.
(Multiple Choice)
4.8/5 (33)
From a sample of individuals the following percentages are reported:
- 75% of cat lovers prefer Brand 1 cola.
- 70% of dog lovers prefer Brand 1 cola.
- 55% of individuals that don't like cats or dogs prefer Brand 1 cola.
- 30% are cat lovers and 40% are dog lovers.
Create a contingency table with percentages describing the relationship between pet preference and cola preference.
(Essay)
4.7/5 (39)
A real estate company kept a database on the apartments in a certain city.The percentages of various types of apartments are listed below. Type Percent Studio 15.9 1-bedroom 25.5 2-bedroom 45.8 3-bedroom 10.1 What percentage of the apartments in the city are 1-bedroom or 2-bedroom apartments?
(Multiple Choice)
4.9/5 (34)
A survey of automobiles parked in student and staff lots at a large university classified the brands by region of origin,as seen in the table.
Origin Student Staff North American 91 90 European 31 16 Asian 68 54 What is the marginal distribution of origin?
(Multiple Choice)
4.9/5 (32)
Statistics Canada gives the following mortality data for Canada in 2011. Cause of Death Percent Cancer 29.9 Heart disease 19.7 Stroke 5.5 Respiratory diseases 4.6 Accidents 4.4 Is it reasonable to conclude that cancer or accidents were the cause of approximately 34.3% of deaths in 2011?
(Multiple Choice)
4.9/5 (32)
A company held a cholesterol screening clinic for its employees.The results are summarized in the table below by age group and cholesterol level. age cholesterol level Under 30 30-49 Over 49 Low 31 38 24 Borderline 50 96 111 High 18 46 63 Create a segmented bar graph which shows the conditional distributions of cholesterol levels for each age group.
(Essay)
4.9/5 (38)
A college examined the impact of an applicant's ethnicity on the likelihood of admission to a particular program.The data are summarized in the table below. Admission Decision EHTNICITY Accepted Wait-listed Tumed away Total Black/Hispanic 489 0 34 523 Asian 92 46 133 271 White 316 260 363 939 Total 897 306 530 1733 What percent of all applicants were turned away?
(Multiple Choice)
4.9/5 (47)
A college examined the impact of an applicant's ethnicity on the likelihood of admission to a particular program.The data are summarized in the table below. Admission Decision EHTNICITY Accepted Wait-listed Tumed away Total Black/Hispanic 482 0 20 502 Asian 107 53 135 295 White 330 249 352 931 Total 919 302 507 1728 What percent of White applicants were accepted?
(Multiple Choice)
4.7/5 (31)
A company held a blood pressure screening clinic for its employees.The results are summarized in the table below by age group and blood pressure level. AGE BLOOD PRESSURE Under 30 30-49 Over 49 Low 28 44 34 Normal 50 98 88 High 25 52 66 Find the conditional distribution of blood pressure level for employees under 30.
(Multiple Choice)
4.9/5 (36)
A company held a blood pressure screening clinic for its employees.The results are summarized in the table below by age group and blood pressure level. AGE BLOOD PRESSURE Under 30 30-49 Over 49 Low 22 37 30 Normal 42 91 94 High 18 50 68 Find the conditional distribution of blood pressure level for employees in the 30-49 age group.
(Multiple Choice)
4.8/5 (30)
Statistics Canada gives the following mortality data for Canada in 2011. Cause of Death Percent Cancer 29.9 Heart disease 19.7 Stroke 5.5 Respiratory diseases 4.6 Accidents 4.4 Create a bar chart to display the mortality percentages for all causes in Canada in 2011.
(Essay)
4.8/5 (44)
A survey of automobiles parked in student and staff lots at a large university classified the brands by country of origin,as seen in the table.
Origin Student Staff North American 103 92 European 39 21 Asian 68 45 What is the conditional distribution of origin for staff?
(Multiple Choice)
4.8/5 (44)
The City of Windsor Department of Parks and Recreation is planning to build a recreation centre in one of the city's parks.They conducted a poll to find out which of five types of physical activities the local population would be interested in.The poll was based on telephone responses from 1013 randomly selected adults.The table shows the percentages of people who expressed interest in various activities. Activity Percent Running/Walking 56\% Weight Training 48\% Biking 33\% Aerobics 25\% Swimming 13\% Which of the following displays is/are appropriate to describe the data for these five activities? (More than one display may be appropriate.)
I 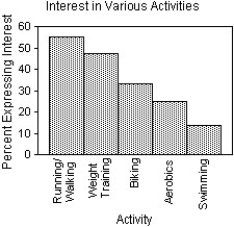 II
II 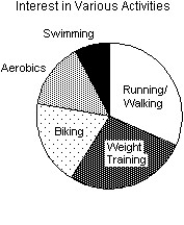 III
III 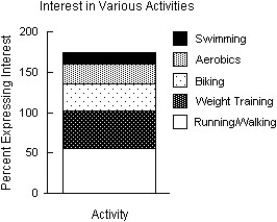
(Multiple Choice)
4.9/5 (45)
Filters
- Essay(0)
- Multiple Choice(0)
- Short Answer(0)
- True False(0)
- Matching(0)