Exam 13: Definite Integrals - Techniques
Exam 1: Linear Equations and Functions245 Questions
Exam 2: Quadratic and Other Special Functions120 Questions
Exam 3: Matrices230 Questions
Exam 4: Inequalities and Linear Programming119 Questions
Exam 5: Exponential and Logarithmic Functions109 Questions
Exam 6: Mathematics of Finance131 Questions
Exam 7: Introduction to Probability180 Questions
Exam 8: Further Topics in Probability and Data Description114 Questions
Exam 9: Derivatives249 Questions
Exam 10: Derivatives172 Questions
Exam 11: Derivatives Continued139 Questions
Exam 12: Indefinite Integrals120 Questions
Exam 13: Definite Integrals - Techniques370 Questions
Exam 13: A: Definite Integrals - Techniques370 Questions
Exam 14: Functions of Two or More Variables122 Questions
Exam 15: Algebraic Concepts 240 Questions
Exam 15: Algebraic Concepts 374 Questions
Exam 15: Algebraic Concepts 496 Questions
Exam 15: Algebraic Concepts 599 Questions
Select questions type
Equations are given whose graphs enclose a region. Find the area of the region. 
(Multiple Choice)
4.9/5  (51)
(51)
Use integration by parts to evaluate the integral  . Note that evaluation may require integration by parts more than once.
(Multiple Choice)
4.9/5 (42)
True or false. For the function  gives the area between the graph of
  and the x-axis from
  .
.
(True/False)
4.9/5 (33)
Use the function  from
from  to
to  and n equal subintervals with the function evaluated at the right-hand endpoints of each subinterval. Find a formula for the sum of the areas of the n rectangles (call this S).
(Multiple Choice)
4.8/5 (37)
The demand function for a product is  where p is in millions of dollars and x is the number of thousands of units. If the equilibrium price is $6 million, what is the consumer's surplus? Round your answer to the nearest million dollars.
(Multiple Choice)
4.8/5 (31)
If the supply function for x units of a commodity is  dollars, what is the producer's surplus at
  ? Round your answer to the nearest dollar.
(Multiple Choice)
4.8/5 (43)
Use integration by parts to evaluate  . Note that evaluation may require integration by parts more than once.
(Multiple Choice)
4.7/5 (34)
The following income distribution data define points on Lorenz curves, where x represents the fraction of a certain country's population and L(x) the cumulative percent of income held by fraction x. Use this data and a numerical method to evaluate  and hence to find the Gini coefficient of income for this country in 1995 and 2003. Round your answers to three decimal places.
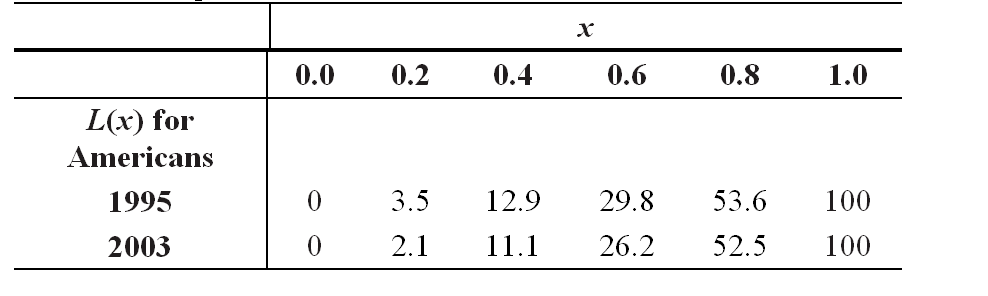
(Multiple Choice)
4.8/5 (38)
Suppose the marginal cost for x units of a good is 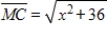 (dollars per unit) and if the fixed cost is $200. What is the total cost of producing 4 units of this good? Round your answer to the nearest dollar.
(Multiple Choice)
4.9/5 (40)
The following income distribution data define points on Lorenz curves, where x represents the fraction of a certain country's population and L(x) the cumulative percent of income held by fraction x. Use this data and a numerical method to evaluate  and hence to find the Gini coefficient of income for this country in 1995 and 2003. Round your answers to three decimal places.
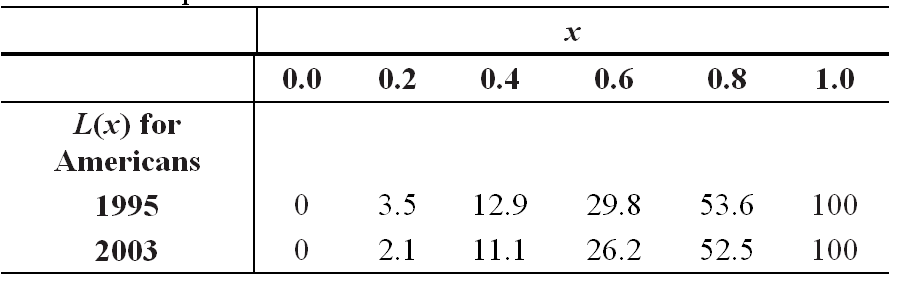
(Multiple Choice)
5.0/5 (44)
Evaluate the given integral with the Fundamental Theorem of Calculus 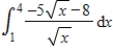 .
.
(Multiple Choice)
4.9/5 (41)
For what value of c is the function 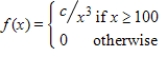 a probability density function?
(Multiple Choice)
4.8/5 (31)
Suppose that the rate of production of a product (in units per week) is measured at the end of each of the first 5 weeks after start-up, and the following data are obtained. Use the Trapezoidal Rule to approximate the total number of units produced in the first 5 weeks. Round your answer to two decimal places.

(Multiple Choice)
4.8/5 (38)
Suppose that the demand function for an appliance is 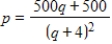 where q is the number of units and p is in dollars. What is the consumer's surplus if the equilibrium price is $17.6 and the equilibrium quantity is 21? Round your answer to the nearest dollar.
(Multiple Choice)
4.8/5 (28)
When the area under  from
from  to
to  is approximated, the formulas for the sum of n rectangles using left-hand endpoints and right-hand endpoints are:
Left-hand endpoints:
is approximated, the formulas for the sum of n rectangles using left-hand endpoints and right-hand endpoints are:
Left-hand endpoints: 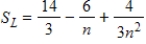
Right-hand endpoints:
Right-hand endpoints: 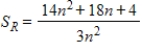
Find
Find 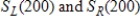
(Multiple Choice)
5.0/5 (29)
Suppose the presence of phosphates in certain waste products dumped into a lake promotes the growth of algae. Rampant growth of algae affects the oxygen supply in the water, so an environmental group wishes to estimate the area of algae growth. The group measures the length across the algae growth (see the figure) and obtains the following data (in feet). 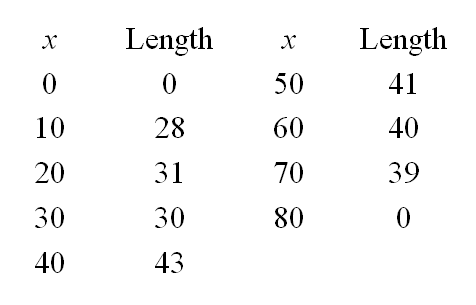
Use 8 rectangles with bases of 10 feet and lengths measured at the left-hand endpoints to approximate the area of the algae growth.
Use 8 rectangles with bases of 10 feet and lengths measured at the left-hand endpoints to approximate the area of the algae growth. 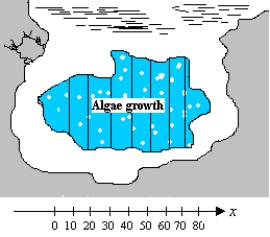
(Multiple Choice)
4.9/5 (38)
Filters
- Essay(0)
- Multiple Choice(0)
- Short Answer(0)
- True False(0)
- Matching(0)