Exam 7: Sampling and Sampling Distributions
Exam 1: Statistics and Data68 Questions
Exam 2: Tabular and Graphical Methods99 Questions
Exam 3: Numerical Descriptive Measures123 Questions
Exam 4: Basic Probability Concepts107 Questions
Exam 5: Discrete Probability Distributions118 Questions
Exam 6: Continuous Probability Distributions114 Questions
Exam 7: Sampling and Sampling Distributions110 Questions
Exam 8: Interval Estimation111 Questions
Exam 9: Hypothesis Testing111 Questions
Exam 10: Statistical Inference Concerning Two Populations104 Questions
Exam 11: Statistical Inference Concerning Variance96 Questions
Exam 12: Chi-Square Tests100 Questions
Exam 13: Analysis of Variance89 Questions
Exam 14: Regression Analysis116 Questions
Exam 15: Inference With Regression Models117 Questions
Exam 16: Regression Models for Nonlinear Relationships95 Questions
Exam 17: Regression Models With Dummy Variables117 Questions
Exam 18: Time Series and Forecasting103 Questions
Exam 19: Returns, Index Numbers and Inflation98 Questions
Exam 20: Nonparametric Tests99 Questions
Select questions type
A random sample of size 36 is taken from a population with mean  and standard deviation
  . Refer to Exhibit 7-5.What is the expected value and the standard deviation for the sampling distribution of the sample mean?
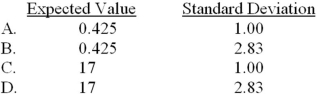
(Multiple Choice)
4.8/5  (38)
(38)
A parameter is a random variable,whereas a sample statistic is a constant.
(True/False)
4.9/5 (33)
In any production process,variation in the quality of the end product is inevitable.Chance variation,or common variation,refers to ___________.
(Multiple Choice)
4.8/5 (34)
A random sample of size 100 is taken from a population described by the proportion  . Refer to Exhibit 7-6.The probability that the sample proportion is between 0.55 and 0.62 is __________.
(Multiple Choice)
4.9/5 (43)
A sample consists of all items of interest in a statistical problem,whereas a population is a subset of the population.We calculate a parameter to make inferences about the unknown sample statistic.
(True/False)
4.9/5 (29)
A tutoring company claims that 75% of the high school students who hire one of their tutor's will improve their grades.
A)In a sample of 100 high school students,what is the probability that 80% or more improved their grades?
B)In a sample of 200 high school students,what is the probability that 80% or more improved their grades?
C)Comment on the reason for the difference between the computed probabilities in parts a and b.
(Essay)
4.8/5 (30)
A mining company made some changes to their mining process in an attempt to save fuel.Before the changes were made,it took an average of 20 gallons of diesel fuel to mine 1,000 pounds of copper.Suppose the standard deviation of fuel used per 1,000 pounds of copper mined is 6 gallons.After the changes were made,the company only used an average of 18 gallons of diesel for the next 30,000 pounds of copper mined.
A)How unusual would it be to get a sample average of 18 gallons or less for 30,000 pounds of copper mined if the changes to the mining process had no effect?
B)Do you think the changes in the mining process actually lowered the fuel used? Explain.
(Short Answer)
4.8/5 (38)
Super Bowl XLVI was played between the New York Giants and the New England Patriots in Indianapolis.Due to a decade-long rivalry between the Patriots and the city's own team,the Colts,most Indianapolis residents were rooting heartily for the Giants.Suppose that 90% of Indianapolis residents wanted the Giants to beat the Patriots. Refer to Exhibit 7-9.What is the probability that from a sample of 200 Indianapolis residents,fewer than 170 were rooting for the Giants in Super Bowl XLIV?
(Multiple Choice)
4.8/5 (34)
For any population  with expected value µ and standard deviation σ,the sampling distribution of
  will be approximately normal if the sample size n is sufficiently small.As a general guideline,the normal distribution approximation is justified when
  .
.
(True/False)
4.9/5 (38)
A random sample of size 100 is taken from a population described by the proportion  . Refer to Exhibit 7-6.The probability that the sample proportion is less than 0.55 is ________.
(Multiple Choice)
4.8/5 (30)
Statistics are used to estimate population parameters,particularly when it is impossible or too expensive to poll an entire population.A particular value of a statistic is referred to as a(n)_______.
(Multiple Choice)
4.9/5 (33)
A manufacturing process produces computer chips in batches of 100.The firm believes that the percent of defective computer chips is 2%.If in five batches the percent defective were 3%,8%,1%,2%,and 7%,how many of these fell outside of the upper or lower control limits for the proportion of defective computer chips in a batch?
(Multiple Choice)
4.9/5 (34)
Suppose that,on average,electricians earn approximately  dollars per year in the United States.Assume that the distribution for electrician's yearly earnings is normally distributed and that the standard deviation is
  dollars. Refer to Exhibit 7-2.What is the probability that the average salary of four randomly selected electricians is more than $50,000 but less than $60,000?
(Multiple Choice)
4.9/5 (33)
In a large metropolitan area,the top providers for television and Internet services are a phone company,a satellite company,and a cable company.The satellite company serves 43% of the homes in the area.What is the probability that in a survey of 1,000 homes,more than 447 of them are served by the satellite company?
(Short Answer)
4.9/5 (28)
A bottled water plant utilizes a production process designed to fill bottles with 20 ounces of water.The population of filling volumes is normally distributed with a standard deviation of 1.3 ounces.Periodically,process engineers take 20-bottle samples and compute the sample mean.
A)What are the upper and lower control limits?
B)Suppose the last five sample means were 19.4,20.2,20.5,20.7,and 21.1 ounces.Is the process under control?
(Essay)
4.8/5 (29)
Successful firms must focus on the quality of the products and services that they offer.Which factor(s)contributes to the quest for quality?
(Multiple Choice)
4.9/5 (32)
The labor force participation rate is the number of people in the labor force divided by the number of people in the country that are of working age and not institutionalized.The BLS reported in February of 2012 that the labor force participation rate in the United States was 63.7% (Calculatedrisk.com).A marketing company asks 120 working-age people if they either have a job or are looking for a job,or,in other words,whether they are in the labor force. Refer to Exhibit 7-8.What is the expected value and the standard deviation for a labor participation rate in the company's sample? 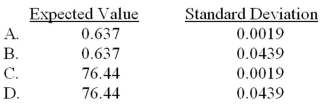
(Multiple Choice)
4.9/5 (39)
Filters
- Essay(0)
- Multiple Choice(0)
- Short Answer(0)
- True False(0)
- Matching(0)