Exam 28: Using Statistics for Decision Making
Exam 2: Data28 Questions
Exam 3: Surveys and Sampling28 Questions
Exam 4: Displaying and Describing Categorical Data32 Questions
Exam 5: Displaying and Describing Quantitative Data32 Questions
Exam 6: Scatterplots, Association, and Correlation32 Questions
Exam 7: Introduction to Linear Regression32 Questions
Exam 8: Randomness and Probability32 Questions
Exam 9: Random Variables and Probability Distributions28 Questions
Exam 10: Sampling Distributions28 Questions
Exam 11: Confidence Intervals for Proportions32 Questions
Exam 12: Testing Hypotheses About Proportions36 Questions
Exam 13: Confidence Intervals and Hypothesis Tests for Means36 Questions
Exam 14: Comparing Two Means32 Questions
Exam 15: Design of Experiments and Analysis of Variance Anova24 Questions
Exam 16: Inference for Counts: Chi-Square Tests26 Questions
Exam 17: Nonparametric Methods23 Questions
Exam 18: Inference for Regression32 Questions
Exam 19: Understanding Regression Residuals28 Questions
Exam 20: Multiple Regression22 Questions
Exam 21: Building Multiple Regression Models22 Questions
Exam 22: Time Series Analysis28 Questions
Exam 23: Decision Making and Risk32 Questions
Exam 24: Quality Control28 Questions
Exam 25: Exploring and Collecting Data28 Questions
Exam 26: Understanding Probability Distributions and Statistical Inference70 Questions
Exam 27: Exploring Relationships Among Variables40 Questions
Exam 28: Using Statistics for Decision Making26 Questions
Select questions type
In order to achieve higher levels of customer satisfaction, a company begins monitoring the complaint resolution process of its customer service representatives. As a first step, the company decides to collect data on the number of unanswered calls out of the first 250 incoming calls to its call centre made each day. At the end of monitoring 25 days, it was found that a total of 500 incoming calls went unanswered. The control limits for the p-chart of these data are
Free
(Multiple Choice)
4.7/5  (35)
(35)
Correct Answer: Verified
A
Use the following to answer the question(s) below.
The monthly returns on a social choice portfolio comprised of "green" companies are shown below for the last six months of 2007.
Month Monthly Return
July 2.2 %
August 2.5
September 1.8
October 1.4
November 1.1
December 1.9
-The forecasted monthly return for January 2008 using a three-month moving average is
Free
(Multiple Choice)
4.8/5 (30)
Correct Answer:Verified
E
Machine oil is used by clothing manufacturers to lubricate and protect sewing machines. A company that produces machine oil must ensure that the viscosity of its product meets customer requirements. Consequently, the viscosity of every batch of oil produced is measured. Suppose that the process mean is 101 cP and the process standard deviation is 1.50 cP. What is the Cpk index if the customer specifications require viscosity of the machine oil to be 100 cP ± 4.5 cP?
Free
(Multiple Choice)
4.8/5 (48)
Correct Answer:Verified
C
Use the following to answer the question(s) below.
The time series graph below shows annual sales figures (in thousands of dollars) for a well known department store chain. 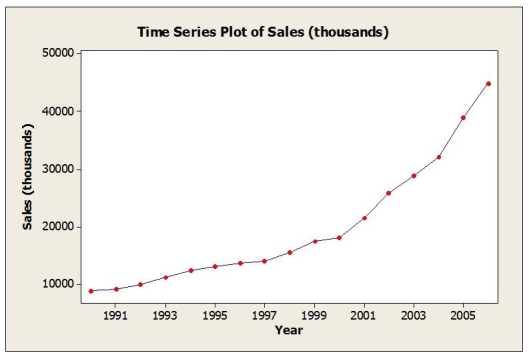 -Which model would be most appropriate for forecasting this series?
(Multiple Choice)
4.8/5 (39)
A producer of specialty products uses a variety of natural and man-made materials to make unique countertops for kitchens and baths. One product line mixes concrete and natural river stone to make countertops that are polished to a high shine revealing unique patterns. Occasionally coarse sand will result in undesirable pitting and rough spots on surfaces. Consequently, as part of its quality control efforts, 8 by 4 metre polished slabs are checked periodically for imperfections. For each slab inspected the number of imperfections (pits, rough spots, etc.) is recorded. If the average number of imperfections per 8 by 4 metre polished slab is 2.6, the control limits for the appropriate control chart are
(Multiple Choice)
4.8/5 (42)
An automatic filling process is used to dispense hand sanitizer into small purse size bottles. The target weight is 75 ml. The company has initiated control charting to stabilize and improve the automatic filling process. For each of twenty-five samples consisting of four bottles, the contents were measured and the mean weight and range were determined. The average of the means across all samples was found to be 72.5 ml. and the average range was 2.75 ml. The control limits for the x-bar chart are
(Multiple Choice)
4.9/5 (22)
Use the following to answer the question(s) below.
The time series graph below shows annual sales figures (in thousands of dollars) for a well known department store chain.
-The dominant time series component in these data is
(Multiple Choice)
4.8/5 (34)
An automatic filling process is used to dispense hand sanitizer into small purse size bottles. The target weight is 75 ml. The company has initiated control charting to stabilize and improve the automatic filling process. For each of twenty-five samples consisting of four bottles, the contents were measured and the mean weight and range were determined. The average of the means across all samples was found to be 72.5 ml. and the average range was 2.75 ml. The control limits for the R chart are
(Multiple Choice)
4.7/5 (33)
Machine oil is used by clothing manufacturers to lubricate and protect sewing machines. A company that produces machine oil must ensure that the viscosity of its product meets customer requirements. Consequently, the viscosity of every batch of oil produced is measured. Suppose that the process mean is 101 cP and the process standard deviation is 1.50 cP. What type of chart should be used to ensure the process remains in control?
(Multiple Choice)
4.7/5 (44)
By design, a required dimension on a part is 0.575 cm plus or minus 0.008 cm. Assume that the process producing this part is stable with a mean of 0.579 cm and standard deviation of 0.002 cm. What is the Cp index?
(Multiple Choice)
4.9/5 (43)
Quarterly returns were forecasted for a mutual fund made up of technology stocks. The forecast errors for the last six quarters are as follows: -0.47, 1.12, -0.85, 1.27, 0.07, and -0.05. The MAD based on these forecast errors is
(Multiple Choice)
4.7/5 (28)
Use the following to answer the question(s) below.
The monthly returns on a social choice portfolio comprised of "green" companies are shown below for the last six months of 2007.
Month Monthly Return
July 2.2 %
August 2.5
September 1.8
October 1.4
November 1.1
December 1.9
-Use a single exponential smoothing (SES) model with α = 0.8 to forecast for January 2008. Assume that the forecast for December 2007 was 1.18 %.
(Multiple Choice)
4.8/5 (34)
Use the following to answer the question(s) below.
Sunny Side Condominiums recently purchased land outside of Toronto and is trying to decide the size complex it should build (large or small). The following payoff table (in thousands of dollars) considers three possible levels of demand. 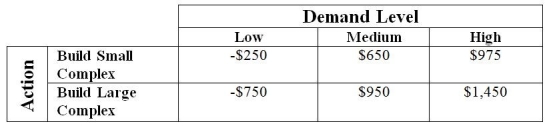 -If there is a 45% chance that the demand level will be low, 30% that it will be medium and 25% chance that it will be high, the expected value (in thousands of dollars) associated with the best action is
(Multiple Choice)
4.7/5 (40)
The standard deviations (in thousands of dollars) for building a small and large complex are 535 and 976, respectively. Based on the resulting coefficients of variation (CV), which of the following statements would be true?
(Multiple Choice)
4.9/5 (34)
An automatic filling process is used to dispense hand sanitizer into small purse size bottles. The target weight is 75 ml. The company has initiated control charting to stabilize and improve the automatic filling process. For each of twenty-five samples consisting of four bottles, the contents were measured and the mean weight and range were determined. The average of the means across all samples was found to be 72.5 ml. and the average range was 2.75 ml. The estimate of the process standard deviation is
(Multiple Choice)
4.8/5 (26)
A producer of specialty products uses a variety of natural and man-made materials to make unique countertops for kitchens and baths. One product line mixes concrete and natural river stone to make countertops that are polished to a high shine revealing unique patterns. Occasionally coarse sand will result in undesirable pitting and rough spots on surfaces. Consequently, as part of its quality control efforts, 8 by 4 metre polished slabs are checked periodically for imperfections. For each slab inspected the number of imperfections (pits, rough spots, etc.) is recorded. What type of control chart should be used for these data?
(Multiple Choice)
4.7/5 (35)
Filters
- Essay(0)
- Multiple Choice(0)
- Short Answer(0)
- True False(0)
- Matching(0)