Exam 17: Nonparametric Methods
Exam 2: Data28 Questions
Exam 3: Surveys and Sampling28 Questions
Exam 4: Displaying and Describing Categorical Data32 Questions
Exam 5: Displaying and Describing Quantitative Data32 Questions
Exam 6: Scatterplots, Association, and Correlation32 Questions
Exam 7: Introduction to Linear Regression32 Questions
Exam 8: Randomness and Probability32 Questions
Exam 9: Random Variables and Probability Distributions28 Questions
Exam 10: Sampling Distributions28 Questions
Exam 11: Confidence Intervals for Proportions32 Questions
Exam 12: Testing Hypotheses About Proportions36 Questions
Exam 13: Confidence Intervals and Hypothesis Tests for Means36 Questions
Exam 14: Comparing Two Means32 Questions
Exam 15: Design of Experiments and Analysis of Variance Anova24 Questions
Exam 16: Inference for Counts: Chi-Square Tests26 Questions
Exam 17: Nonparametric Methods23 Questions
Exam 18: Inference for Regression32 Questions
Exam 19: Understanding Regression Residuals28 Questions
Exam 20: Multiple Regression22 Questions
Exam 21: Building Multiple Regression Models22 Questions
Exam 22: Time Series Analysis28 Questions
Exam 23: Decision Making and Risk32 Questions
Exam 24: Quality Control28 Questions
Exam 25: Exploring and Collecting Data28 Questions
Exam 26: Understanding Probability Distributions and Statistical Inference70 Questions
Exam 27: Exploring Relationships Among Variables40 Questions
Exam 28: Using Statistics for Decision Making26 Questions
Select questions type
Which of the following statements is false regarding nonparametric methods?
Free
(Multiple Choice)
4.8/5  (38)
(38)
Correct Answer: Verified
C
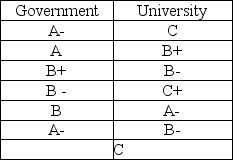
Suppose that 6 economists who work for the federal government and 7 university economists were asked to grade the effectiveness of the federal government's stimulus bill in terms of its ability to increase jobs over the next two years. The grades are shown below. Do the two groups differ in terms of their opinion?
 a. What nonparametric method is appropriate for analyzing these data?
b. Are the assumptions satisfied for applying this method? Explain.
c. State the null and alternative hypotheses.
d. Perform the test and state your conclusion at α = 0.10.
a. What nonparametric method is appropriate for analyzing these data?
b. Are the assumptions satisfied for applying this method? Explain.
c. State the null and alternative hypotheses.
d. Perform the test and state your conclusion at α = 0.10.
Free
(Essay)
4.9/5 (42)
Correct Answer:Verified
a. Wilcoxon rank-sum / Mann-Whitney statistic.
b. Yes. We can assume that the data values are mutually independent (Independence Assumption) and the two groups are independent (Independent Groups Assumption).
c. H0: The government and university economists have the same typical opinion.
HA: The government and university economists have different typical opinions.
d.
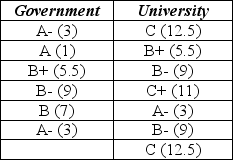 The ranks are shown in parentheses above. T1 = 28.5. Critical values from the table are TL = 30 and TU = 54. Therefore we reject the null hypothesis and conclude that the two groups of economists do not have the same typical opinion about the economic stimulus bill.
Suppose that ten new smart phone models were evaluated by two consumer electronics magazines from 1 (best) to 10 (worst). Spearman's rho was calculated to be -0.45. We can say that
Free
(Multiple Choice)
4.9/5 (29)
Correct Answer:Verified
D
A management professor was teaching a course in business leadership as part of an executive MBA program. She divided her class of 10 executives into two equal sized groups and used a different approach to teach about various leadership styles (case study and online interactive). To compare the effectiveness of the two approaches, the appropriate nonparametric procedure is the
(Multiple Choice)
4.7/5 (41)
Consider the following to answer the question(s) below:
A paint manufacturer is interested in determining whether there is a difference in the median time it takes for two different brands of paint to dry once they have been applied to a wall surface. To test this, the company has selected a random sample of 5 walls and applied Brand 1, and another 5 walls and applied Brand 2. The following data reflect the actual drying time in hours:
 -The appropriate nonparametric method to use for these data is the
(Multiple Choice)
4.7/5 (38)
The best tasting ice creams are generally high in fat content, which gives them a creamy texture. Four brands of ice cream (two national and two local) were tested by consumers who rated how "creamy" they tasted on a 5-point Likert type scale (1 = not creamy to 5 = very creamy). Each brand was rated by a different group of consumers. The appropriate nonparametric method to use for these data is the
(Multiple Choice)
4.9/5 (38)
Suppose the Wilcoxon signed-rank test was used on seven pairs of data. If the calculated test statistic for a two-tailed test was found to be 5, at α = 0.05 we can conclude that
(Multiple Choice)
4.8/5 (34)
The Wilcoxon signed-rank test is used to test which of the following types of hypotheses?
(Multiple Choice)
4.8/5 (38)
For the scatterplots shown below, indicate what about the data make nonparametric
methods appropriate for measuring the association between x and y.
a. 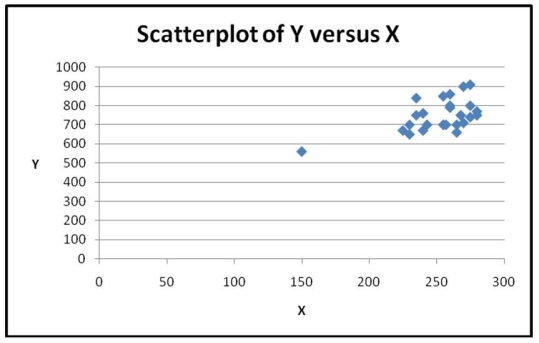 b.
b. 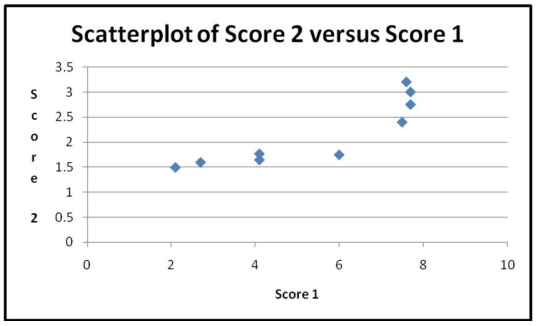
(Essay)
4.8/5 (31)
Consumers were asked to "rate" the taste of three popular brands of yogurt that have been modified to include fibre. The data are shown in the table below. Are there differences in the results among the three brands?
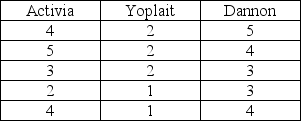 a. What nonparametric method is appropriate for analyzing these data?
b. State the null and alternative hypotheses.
c. Perform the test and state your conclusion at α = 0.05.
d. If these data did satisfy the assumptions for performing ANOVA, what are the disadvantages of using this nonparametric method instead?
a. What nonparametric method is appropriate for analyzing these data?
b. State the null and alternative hypotheses.
c. Perform the test and state your conclusion at α = 0.05.
d. If these data did satisfy the assumptions for performing ANOVA, what are the disadvantages of using this nonparametric method instead?
(Essay)
4.8/5 (33)
Suppose the Wilcoxon signed-rank test was used on ten pairs of data. If the calculated test statistic for a two-tailed test was found to be 6, at α = 0.05 we can conclude that
(Multiple Choice)
4.8/5 (36)
Consider the following to answer the question(s) below:
A paint manufacturer is interested in determining whether there is a difference in the median time it takes for two different brands of paint to dry once they have been applied to a wall surface. To test this, the company has selected a random sample of 5 walls and applied Brand 1, and another 5 walls and applied Brand 2. The following data reflect the actual drying time in hours:
-Using Tukey's quick test to determine whether there is a difference in the two brands we can say that
(Multiple Choice)
4.8/5 (31)
A particular additive is claimed to increase the fuel efficiency of hybrid vehicles. Eight hybrid cars are used to determine if there is a difference in fuel efficiency (l/100km) with and without the additive. The appropriate nonparametric method to use for these data is the
(Multiple Choice)
4.8/5 (38)
Consider the following to answer the question(s) below:
A paint manufacturer is interested in determining whether there is a difference in the median time it takes for two different brands of paint to dry once they have been applied to a wall surface. To test this, the company has selected a random sample of 5 walls and applied Brand 1, and another 5 walls and applied Brand 2. The following data reflect the actual drying time in hours:
-The sum of all the ranks for this test is
(Multiple Choice)
4.8/5 (39)
Which of the following is not an advantage of the Spearman's Rank Correlation over the correlation coefficient r?
(Multiple Choice)
4.9/5 (38)
Suppose the Kruskal-Wallis test was used to compare four groups. If the test statistic value was found to be 9.545, using α = 0.05 we should
(Multiple Choice)
4.8/5 (37)
The Spearman's rho is equal to 0.18 and the sample size n = 7. The correct value of the test statistic to determine if it is significantly different from zero is
(Multiple Choice)
4.8/5 (32)
Suppose that 6 economists who work for the federal government and 7 university economists were asked to predict the percentage change in the Canada's GDP over the three year period from January 2010 to January 2013. The Wilcoxon rank-sum test was used to determine if the two groups differ in their predictions. The value of the test statistic was calculated to be 29.5. At α = 0.05, we can conclude that
(Multiple Choice)
4.8/5 (29)
The best tasting ice creams are generally high in fat content, which gives them a creamy texture. Four brands of ice cream were tested by consumers who graded their level of creaminess (A = very creamy to F = not creamy). Each brand was rated by a different group of consumers (the data are shown below). Are there differences in perceived creaminess among the four brands?
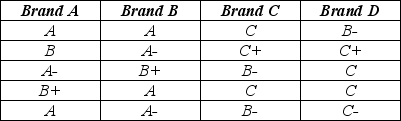 a. What nonparametric method is appropriate for analyzing these data?
b. State the null and alternative hypotheses.
c. Perform the test and state your conclusion at α = 0.10.
d. If these data did satisfy the assumptions for performing ANOVA, what are the disadvantages of using this nonparametric method instead?
a. What nonparametric method is appropriate for analyzing these data?
b. State the null and alternative hypotheses.
c. Perform the test and state your conclusion at α = 0.10.
d. If these data did satisfy the assumptions for performing ANOVA, what are the disadvantages of using this nonparametric method instead?
(Essay)
4.9/5 (37)
Consider the following to answer the question(s) below:
Assume that a Kruskal-Wallis test is being conducted to determine whether or not the medians of three populations are equal. The sum of rankings and the sample size for each group are below.
Group 1 Group 2 Group 3
T1 = 60 T2 = 36 T3 = 24
n1 = 6 n2 = 5 n3 = 4
-At α = 0.05
(Multiple Choice)
4.8/5 (43)
Filters
- Essay(0)
- Multiple Choice(0)
- Short Answer(0)
- True False(0)
- Matching(0)