Exam 6: Scatterplots, Association, and Correlation
Exam 2: Data28 Questions
Exam 3: Surveys and Sampling28 Questions
Exam 4: Displaying and Describing Categorical Data32 Questions
Exam 5: Displaying and Describing Quantitative Data32 Questions
Exam 6: Scatterplots, Association, and Correlation32 Questions
Exam 7: Introduction to Linear Regression32 Questions
Exam 8: Randomness and Probability32 Questions
Exam 9: Random Variables and Probability Distributions28 Questions
Exam 10: Sampling Distributions28 Questions
Exam 11: Confidence Intervals for Proportions32 Questions
Exam 12: Testing Hypotheses About Proportions36 Questions
Exam 13: Confidence Intervals and Hypothesis Tests for Means36 Questions
Exam 14: Comparing Two Means32 Questions
Exam 15: Design of Experiments and Analysis of Variance Anova24 Questions
Exam 16: Inference for Counts: Chi-Square Tests26 Questions
Exam 17: Nonparametric Methods23 Questions
Exam 18: Inference for Regression32 Questions
Exam 19: Understanding Regression Residuals28 Questions
Exam 20: Multiple Regression22 Questions
Exam 21: Building Multiple Regression Models22 Questions
Exam 22: Time Series Analysis28 Questions
Exam 23: Decision Making and Risk32 Questions
Exam 24: Quality Control28 Questions
Exam 25: Exploring and Collecting Data28 Questions
Exam 26: Understanding Probability Distributions and Statistical Inference70 Questions
Exam 27: Exploring Relationships Among Variables40 Questions
Exam 28: Using Statistics for Decision Making26 Questions
Select questions type
The following scatterplot shows Internet Usage and PC adoption (per 100 inhabitants) for a sample of 15 countries. 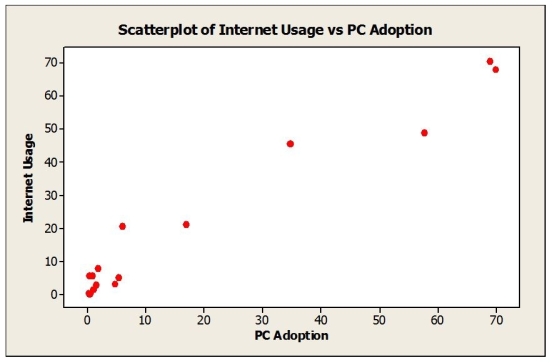 a. Describe the association between Internet usage and PC adoption.
b. Do these data satisfy the conditions for computing a correlation coefficient? Explain.
c. Estimate the correlation.
a. Describe the association between Internet usage and PC adoption.
b. Do these data satisfy the conditions for computing a correlation coefficient? Explain.
c. Estimate the correlation.
Free
(Essay)
4.8/5  (36)
(36)
Correct Answer: Verified
a. Direction: positive; form: straight; strength: strong scatter around the straight form; unusual features: no outliers.
b. Yes, variables are quantitative, the relationship is straight enough, and there are no apparent outliers (although the concentration of points at the lower end and higher end of PC adoption may inflate the correlation).
c. There is a strong linear relationship between Internet usage and PC adoption. The correlation coefficient is over 9.0.
In commenting on the increase in home foreclosures, a news reporter stated "there appears to be a strong correlation between home foreclosures and job loss of the head of household." Comment on this statement.
Free
(Essay)
4.8/5 (37)
Correct Answer:Verified
There may be an association between home foreclosures and the head of household losing his/her job, but these variables are both categorical so they cannot be correlated.
Shown below is a correlation table showing correlation coefficients between stock price, earnings per share (EPS), and the price/earnings (P/E) ratio for a sample of 19 publicly traded companies. Which of the following statements is false? 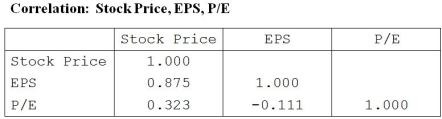
Free
(Multiple Choice)
4.8/5 (43)
Correct Answer:Verified
D
Consider the following sample data. The standard deviations from the data are 3.67 for Y, and 45.28 for X. These sample data are shown as follows: 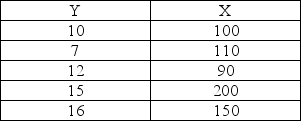 Given this data, the sample correlation is approximately
(Multiple Choice)
4.8/5 (37)
Consider the following to answer the question(s) below:
A consumer research group investigating the relationship between the price of meat (per pound) and the fat content (grams) gathered data that produced the following scatterplot.  -Which best describes the association between the price of meat and fat content?
(Multiple Choice)
4.8/5 (27)
The following scatterplot shows monthly sales figures (in units) and number of months of experience on the job for a sample of 18 salespeople. 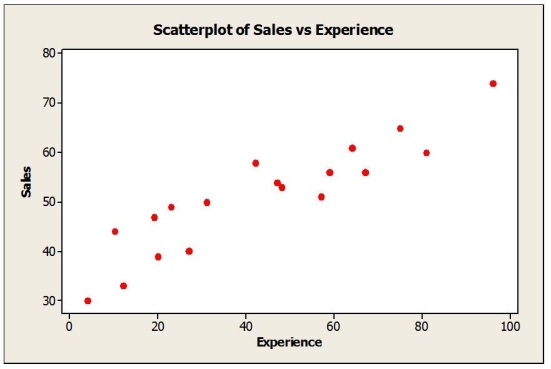 a. Describe the association between monthly sales and level of experience.
b. Do these data satisfy the conditions for computing a correlation coefficient? Explain.
c. Estimate the correlation.
a. Describe the association between monthly sales and level of experience.
b. Do these data satisfy the conditions for computing a correlation coefficient? Explain.
c. Estimate the correlation.
(Essay)
4.9/5 (37)
The following scatterplot shows a relationship between x and y that results in a correlation coefficient of r = 0. Explain why r = 0 in this situation even though there appears to be a strong relationship between the x and y variables. 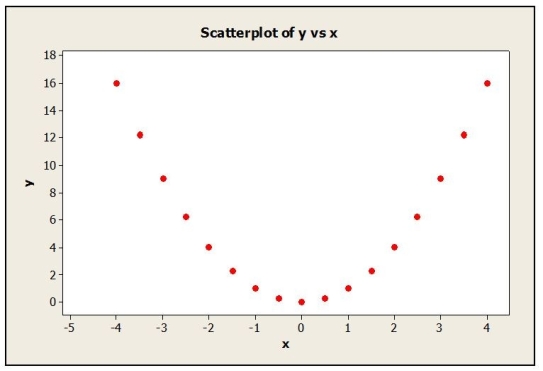
(Essay)
4.8/5 (34)
Based on the scatterplots shown below, describe the association between x and y.
a.  b.
b. 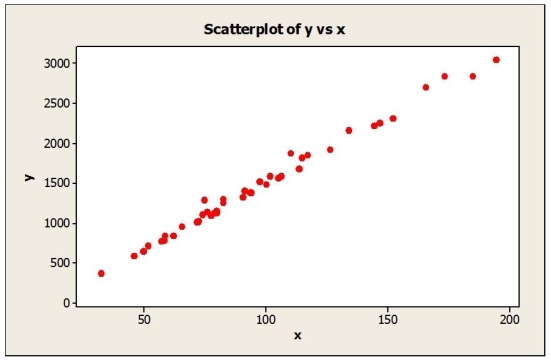
(Essay)
4.8/5 (32)
In discussing how its customers use online services, a bank manager noted "there seems to be a strong correlation between the use of the online bill paying feature and gender." Which of the following is true regarding this statement?
(Multiple Choice)
5.0/5 (39)
In a university statistics course a correlation of -0.8 was found between number of classes missed and course grade. This can be interpreted to mean that
(Multiple Choice)
4.7/5 (40)
Assume that a medical research study found a correlation of -0.73 between regular use of sunscreen and the skin cancer rate. This could be interpreted to mean that
(Multiple Choice)
4.8/5 (42)
A perfect correlation between two variables will always produce which of the following?
(Multiple Choice)
5.0/5 (37)
A study examined consumption levels of oil and carbon dioxide emissions for a sample of counties. The response variable in this study is
(Multiple Choice)
4.9/5 (38)
A consumer research group investigating the relationship between the price of meat (per kilogram) and the fat content (grams) gathered data that produced the following scatterplot. 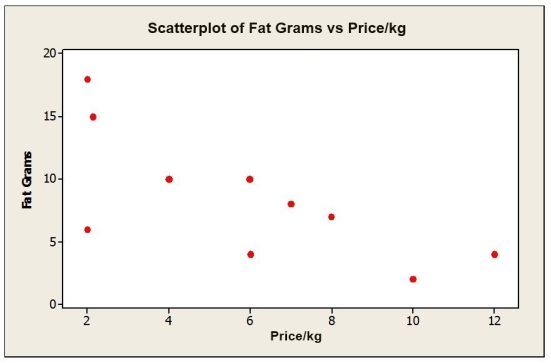 a. Describe the association between the price of meat and fat content.
b. Estimate the correlation.
c. If the point in the lower left hand corner ($2.00 per kilogram, 6 grams of fat) is removed, would the correlation become stronger, weaker, or remain the same? Explain.
a. Describe the association between the price of meat and fat content.
b. Estimate the correlation.
c. If the point in the lower left hand corner ($2.00 per kilogram, 6 grams of fat) is removed, would the correlation become stronger, weaker, or remain the same? Explain.
(Essay)
4.8/5 (42)
A supermarket chain gathers data on the amount they spend on promotional material (specials, coupons, etc.) and sales revenue generated each quarter. The predictor variable is
(Multiple Choice)
4.8/5 (32)
Consider the following to answer the question(s) below:
The following scatterplot shows monthly sales figures (in units) and the number of months of experience on the job for a sample of 18 salespeople.  -The association between monthly sales and number of months of experience can be described as
(Multiple Choice)
4.8/5 (40)
Shown below is a correlation table showing correlation coefficients between stock price, earnings per share (EPS), and the price/earnings (P/E) ratio for a sample of 19 publicly traded companies.  a. What is the correlation between stock price and EPS? Interpret.
b. What is the correlation between stock price and P/E? Interpret.
c. What is the correlation between EPS and P/E? Interpret.
a. What is the correlation between stock price and EPS? Interpret.
b. What is the correlation between stock price and P/E? Interpret.
c. What is the correlation between EPS and P/E? Interpret.
(Essay)
4.8/5 (32)
The University recently sampled five full time students who work off campus in order to look at their GPA and their work schedules. The standard deviation for GPA is 0.91 and the standard deviation for hours worked is 6.78. These sample data are shown as follows: 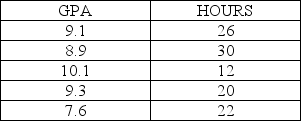 Given these data the sample correlation is
(Multiple Choice)
5.0/5 (24)
Shown below is a correlation table showing correlation coefficients between population (in millions), PC adoption and cell phone adoption for a sample of 16 countries. 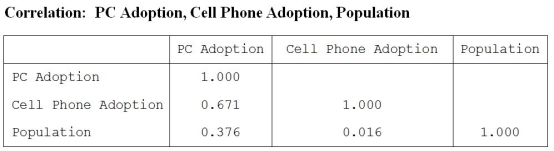 a. What is the correlation between PC adoption and population? Interpret.
b. What is the correlation between cell phone adoption and population? Interpret.
c. What is the correlation between PC adoption and cell phone adoption? Interpret.
a. What is the correlation between PC adoption and population? Interpret.
b. What is the correlation between cell phone adoption and population? Interpret.
c. What is the correlation between PC adoption and cell phone adoption? Interpret.
(Essay)
4.9/5 (29)
Filters
- Essay(0)
- Multiple Choice(0)
- Short Answer(0)
- True False(0)
- Matching(0)