Exam 27: Exploring Relationships Among Variables
Exam 2: Data28 Questions
Exam 3: Surveys and Sampling28 Questions
Exam 4: Displaying and Describing Categorical Data32 Questions
Exam 5: Displaying and Describing Quantitative Data32 Questions
Exam 6: Scatterplots, Association, and Correlation32 Questions
Exam 7: Introduction to Linear Regression32 Questions
Exam 8: Randomness and Probability32 Questions
Exam 9: Random Variables and Probability Distributions28 Questions
Exam 10: Sampling Distributions28 Questions
Exam 11: Confidence Intervals for Proportions32 Questions
Exam 12: Testing Hypotheses About Proportions36 Questions
Exam 13: Confidence Intervals and Hypothesis Tests for Means36 Questions
Exam 14: Comparing Two Means32 Questions
Exam 15: Design of Experiments and Analysis of Variance Anova24 Questions
Exam 16: Inference for Counts: Chi-Square Tests26 Questions
Exam 17: Nonparametric Methods23 Questions
Exam 18: Inference for Regression32 Questions
Exam 19: Understanding Regression Residuals28 Questions
Exam 20: Multiple Regression22 Questions
Exam 21: Building Multiple Regression Models22 Questions
Exam 22: Time Series Analysis28 Questions
Exam 23: Decision Making and Risk32 Questions
Exam 24: Quality Control28 Questions
Exam 25: Exploring and Collecting Data28 Questions
Exam 26: Understanding Probability Distributions and Statistical Inference70 Questions
Exam 27: Exploring Relationships Among Variables40 Questions
Exam 28: Using Statistics for Decision Making26 Questions
Select questions type
Use the following to answer the question(s) below.
Data were collected for a sample of 12 pharmacists to determine if years of experience and salary are related. Below are the regression analysis results. The dependent variable is Salary in thousands of dollars. 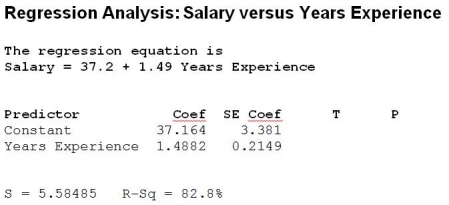 -The standard error of the slope for this estimated regression equation is
Free
(Multiple Choice)
4.9/5  (35)
(35)
Correct Answer: Verified
B
Using the estimated regression equation to predict salary for 10 years of experience gives the following results.  Which of the following is true?
Free
(Multiple Choice)
4.7/5 (33)
Correct Answer:Verified
C
Use the following to answer the questions below.
The following is output from regression analysis performed to develop a model for predicting a firm's Price-Earnings Ratio (PE) based on Growth Rate, Profit Margin, and whether or not the firm is Green (1 = Yes, 0 = No). 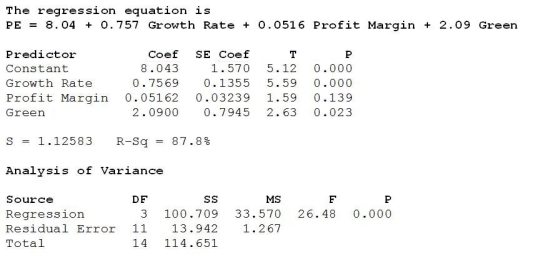 -Based on the F-statistic and associated P-value, we can conclude at α = 0.05 that
Free
(Multiple Choice)
4.9/5 (29)
Correct Answer:Verified
C
Use the following to answer the question(s) below.
In order to examine if there is a relationship between the size of cash bonuses and pay scale, data were obtained on the average annual cash bonus and the average annual pay for a sample of 20 companies. Below is the regression analysis output with annual cash bonus as the dependent variable. 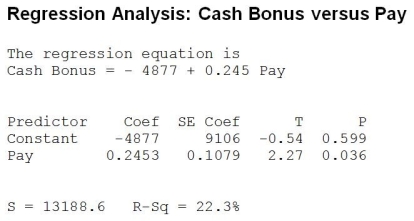 -What is the correlation between average annual cash bonus and average annual pay?
(Multiple Choice)
4.8/5 (34)
Use the following to answer the question(s) below.
A large pharmaceutical company selected a random sample of new hires and obtained their job performance ratings based on their first six months with the company. These data were used to build a multiple regression model to predict the job performance of new hires based on age, GPA and gender (female = 1 and male = 0). The results of the analysis are shown below. 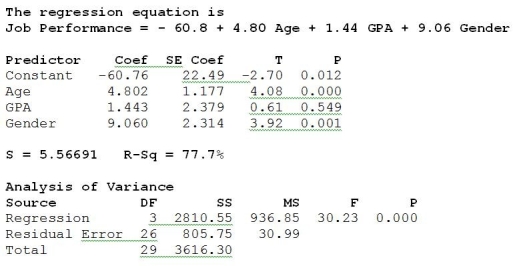 -Based on the F-statistic and associated P-value, we can conclude that at α = 0.05
(Multiple Choice)
4.7/5 (39)
Use the following to answer the question(s) below.
A linear regression model was fit to data representing technology adoption over time. The regression output and residual plot appears below. 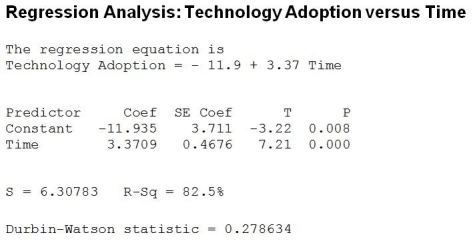
 -Which of the following is true?
(Multiple Choice)
4.9/5 (36)
Which statement about residuals plot is true?
I. A curved pattern indicates nonlinear association between the variables.
II. A pattern of increasing spread indicates the predicted values become less reliable as the explanatory variable increases.
III. If all of the residuals are very small, the model will predict accurately.
(Multiple Choice)
4.8/5 (27)
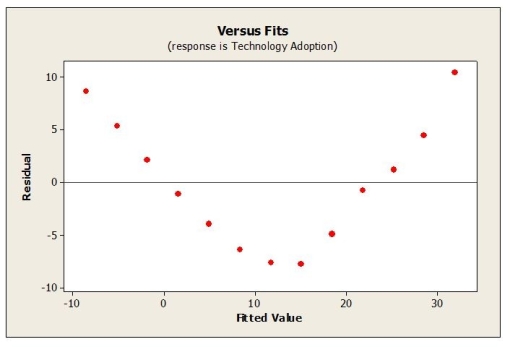
Below is the plot of residuals versus fitted values for this regression model. 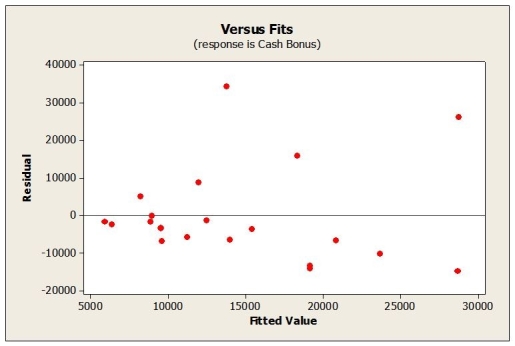 Which assumption appears to be violated?
(Multiple Choice)
4.9/5 (49)
Use the following to answer the question(s) below.
In order to examine if there is a relationship between the size of cash bonuses and pay scale, data were obtained on the average annual cash bonus and the average annual pay for a sample of 20 companies. Below is the regression analysis output with annual cash bonus as the dependent variable.
-At 5% significance level, which of the following statements is true about the correlation between average annual cash bonus and average annual pay?
(Multiple Choice)
4.7/5 (37)
Which statement about re-expressing data is true?
I. Unimodal distributions that are skewed to the left can be made more symmetric by taking the square root of the variable.
II. A curve that is descending as the explanatory variable increases may be straightened by taking a logarithm of the response variable.
III. One goal of re-expression may be to make the variability of the response variable more uniform.
(Multiple Choice)
4.8/5 (27)
Which of the following is the correct interpretation for the regression coefficient of Green?
(Multiple Choice)
4.8/5 (30)
How much of the variability in pharmacists' salary is accounted for by years of experience?
(Multiple Choice)
4.7/5 (27)
Which of the following is the correct interpretation for the regression coefficient of Gender?
(Multiple Choice)
4.9/5 (32)
How much of the variability in tourism revenue is accounted for by the number of foreign visitors?
(Multiple Choice)
4.8/5 (29)
Use the following to answer the question(s) below.
A large pharmaceutical company selected a random sample of new hires and obtained their job performance ratings based on their first six months with the company. These data were used to build a multiple regression model to predict the job performance of new hires based on age, GPA and gender (female = 1 and male = 0). The results of the analysis are shown below.
-How much of the variability in Job Performance is explained by the regression model?
(Multiple Choice)
4.7/5 (39)
Use the following to answer the question(s) below.
Weekly commodity prices for heating oil (in cents) were obtained and regressed against time. Below is the regression output and residual plots from fitting a linear model. 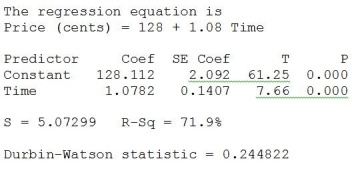
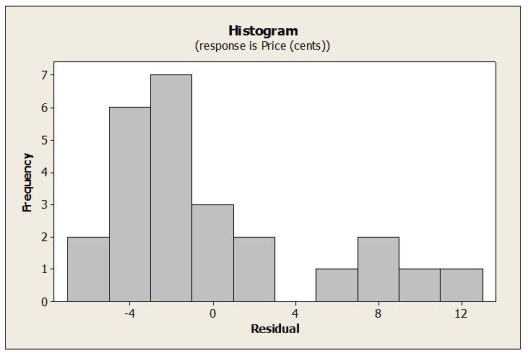
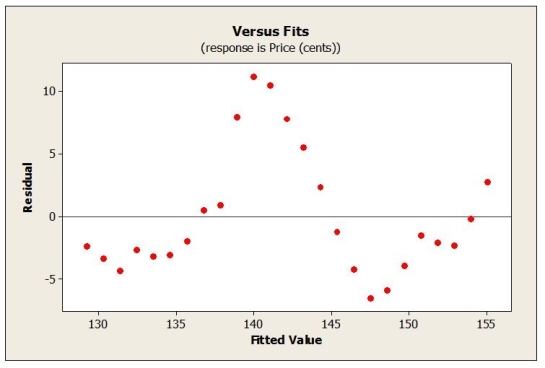
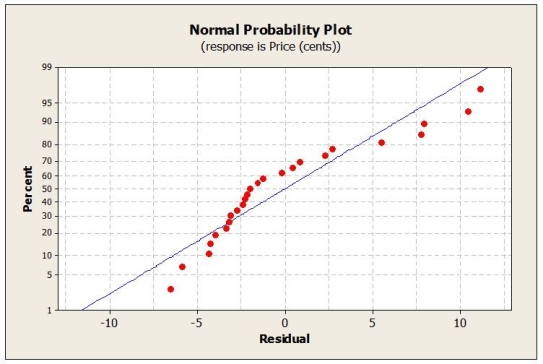 -Which of the following statements is true?
(Multiple Choice)
4.7/5 (43)
The P-value associated with this statistic is < 0.001. At the 0.05 level of significance
(Multiple Choice)
4.9/5 (38)
The model  = 12 + 20dia can be used to predict the breaking strength of a rope (in kilograms) from its diameter (in centimetres). According to this model, how much force should a rope one-half centimetre in diameter withstand?
(Multiple Choice)
4.8/5 (35)
Filters
- Essay(0)
- Multiple Choice(0)
- Short Answer(0)
- True False(0)
- Matching(0)