Exam 5: Displaying and Describing Quantitative Data
Exam 2: Data28 Questions
Exam 3: Surveys and Sampling28 Questions
Exam 4: Displaying and Describing Categorical Data32 Questions
Exam 5: Displaying and Describing Quantitative Data32 Questions
Exam 6: Scatterplots, Association, and Correlation32 Questions
Exam 7: Introduction to Linear Regression32 Questions
Exam 8: Randomness and Probability32 Questions
Exam 9: Random Variables and Probability Distributions28 Questions
Exam 10: Sampling Distributions28 Questions
Exam 11: Confidence Intervals for Proportions32 Questions
Exam 12: Testing Hypotheses About Proportions36 Questions
Exam 13: Confidence Intervals and Hypothesis Tests for Means36 Questions
Exam 14: Comparing Two Means32 Questions
Exam 15: Design of Experiments and Analysis of Variance Anova24 Questions
Exam 16: Inference for Counts: Chi-Square Tests26 Questions
Exam 17: Nonparametric Methods23 Questions
Exam 18: Inference for Regression32 Questions
Exam 19: Understanding Regression Residuals28 Questions
Exam 20: Multiple Regression22 Questions
Exam 21: Building Multiple Regression Models22 Questions
Exam 22: Time Series Analysis28 Questions
Exam 23: Decision Making and Risk32 Questions
Exam 24: Quality Control28 Questions
Exam 25: Exploring and Collecting Data28 Questions
Exam 26: Understanding Probability Distributions and Statistical Inference70 Questions
Exam 27: Exploring Relationships Among Variables40 Questions
Exam 28: Using Statistics for Decision Making26 Questions
Select questions type
Below is a histogram of salaries (in $) for a sample of marketing managers. Comment on the shape of the distribution. 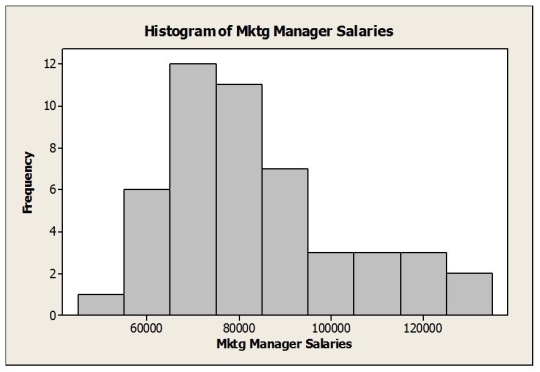
Free
(Essay)
4.9/5  (34)
(34)
Correct Answer: Verified
The distribution is unimodal and skewed to the right.
Consider the following to answer the question(s) below:
The table below shows closing share prices for a small sample of companies.
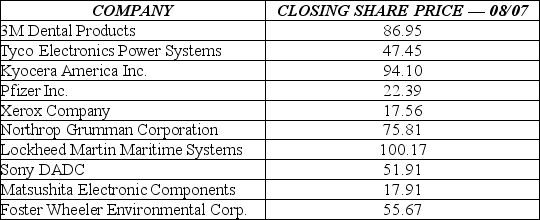 -The standard deviation in closing share prices is
Free
(Multiple Choice)
4.8/5 (38)
Correct Answer:Verified
A
Below is a time series graph for monthly closing price of 3M Dental Products stock (beginning June 2005).  a. Are the closing prices for shares of 3M Dental Products from June 2005 through August 2007 stationary? Explain.
b. Would a histogram provide a good summary of these stock prices? Explain.
a. Are the closing prices for shares of 3M Dental Products from June 2005 through August 2007 stationary? Explain.
b. Would a histogram provide a good summary of these stock prices? Explain.
Free
(Essay)
4.8/5 (26)
Correct Answer:Verified
a. No, an upward trend is evident.
b. No, because these data are not stationary.
Consider the following to answer the question(s) below:
The table below shows closing share prices for a small sample of companies.
-The z score for the share price for Matsushita Electronic Components is
(Multiple Choice)
4.9/5 (35)
The boxplots show monthly sales revenue figures ($ thousands) for a discount office supply company with locations in three different regions in Canada. (Atlantic, Central and West).  a. Which region has the highest median sales revenue?
b. Which region has the lowest median sales revenue?
c. Which region has the most variable sales revenue values? Explain.
a. Which region has the highest median sales revenue?
b. Which region has the lowest median sales revenue?
c. Which region has the most variable sales revenue values? Explain.
(Essay)
4.9/5 (33)
Consider the following to answer the question(s) below:
The table below shows closing share prices for a small sample of companies.
-The mean closing share price is
(Multiple Choice)
4.9/5 (32)
The advantage of using the interquartile range versus the range as a measure of variation is
(Multiple Choice)
4.9/5 (29)
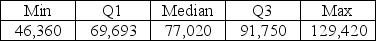
Below is the five-number summary of salaries (in $) for a sample of marketing managers.
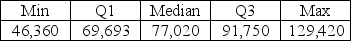 a. Would you expect the mean salary for this sample of marketing managers to be higher or lower than the median? Explain.
b. Which would be a more appropriate measure of central tendency for these data, the mean or median? Explain.
c. Calculate the range.
d. Calculate the IQR.
a. Would you expect the mean salary for this sample of marketing managers to be higher or lower than the median? Explain.
b. Which would be a more appropriate measure of central tendency for these data, the mean or median? Explain.
c. Calculate the range.
d. Calculate the IQR.
(Essay)
4.8/5 (35)
The asking price for homes on the real estate market in Winnipeg has a mean value of $286,455 and a standard deviation of $11,200. The mean and standard deviation in asking price for homes in Moncton are $188,468 and $8,230, respectively. Recently, one home sold in each city where the asking price for each home was $225,000. Based on these data, what conclusions can be drawn?
(Multiple Choice)
4.8/5 (37)
Below is the five-number summary of salaries (in $) for a sample of marketing managers.
 Suppose the marketing manager who was earning $129,420 got a raise and is now earning $140,000. Indicate how this change would affect the following summary statistics (increase, decrease, or stay about the same).
a. Mean
b. Median
c. Range
d. IQR
e. Standard deviation
Suppose the marketing manager who was earning $129,420 got a raise and is now earning $140,000. Indicate how this change would affect the following summary statistics (increase, decrease, or stay about the same).
a. Mean
b. Median
c. Range
d. IQR
e. Standard deviation
(Essay)
4.8/5 (36)
Below is the five number summary of the hourly wages ($) for sales managers.
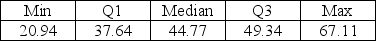 Suppose there had been an error and that the lowest hourly wage for sales managers was $18.50 instead of $20.94. Indicate how this change would affect the following summary statistics (increase, decrease, or stay about the same).
a. Mean
b. Median
c. Range
d. IQR
e. Standard deviation
Suppose there had been an error and that the lowest hourly wage for sales managers was $18.50 instead of $20.94. Indicate how this change would affect the following summary statistics (increase, decrease, or stay about the same).
a. Mean
b. Median
c. Range
d. IQR
e. Standard deviation
(Essay)
4.9/5 (32)
Consider the following to answer the question(s) below:
Below is a histogram and the five number salary for salaries (in $) for a sample of marketing managers. 
 -The shape of this distribution is
(Multiple Choice)
4.8/5 (31)
Below is a time series graph for monthly closing stock prices of 3M Dental Products. Which of the following statements is true? 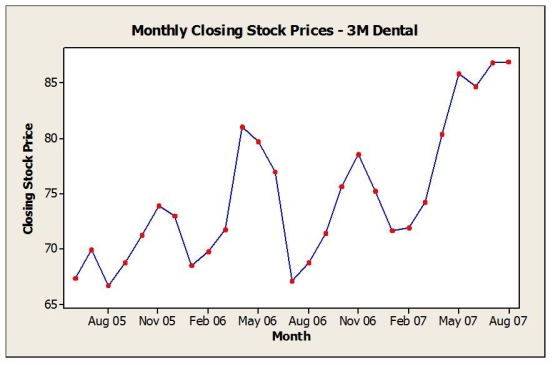
(Multiple Choice)
4.8/5 (30)
The table below shows closing share prices (on the first trading day of August, 2007) for a small sample of companies.
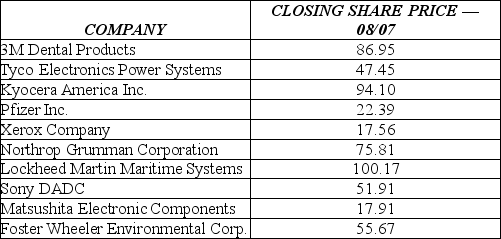 a. Calculate the mean.
b. Calculate the standard deviation.
c. Standardize the share price for Matsushita Electronic Components (find the z score). Interpret its meaning.
a. Calculate the mean.
b. Calculate the standard deviation.
c. Standardize the share price for Matsushita Electronic Components (find the z score). Interpret its meaning.
(Essay)
4.8/5 (31)
Consider the following to answer the question(s) below:
Below is a histogram and the five number salary for salaries (in $) for a sample of marketing managers.
-Do the data contain any outliers as determined by a boxplot?
(Multiple Choice)
4.8/5 (37)
Consider the following to answer the question(s) below:
The boxplots below show monthly sales revenue figures ($ thousands) for a discount office supply company with locations in three different regions of Canada. (Atlantic, Central and West). 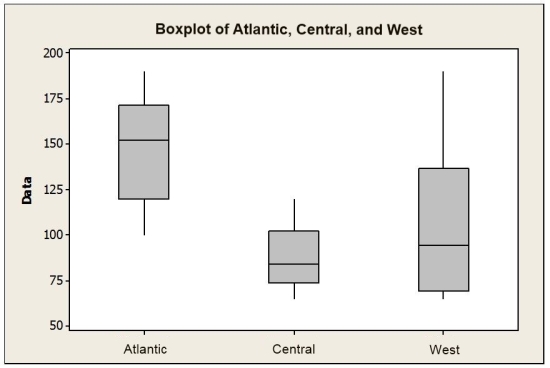 -Which of the following statements is false?
(Multiple Choice)
4.9/5 (26)
The table below shows data on total assets ($ million) for a sample of a bank's branches.
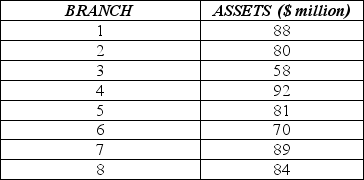 For the data on total assets ($ million) for the sample provided:
a. Calculate the mean.
b. Calculate the standard deviation.
c. Standardize the asset value of the third branch (find the z score). Interpret its meaning.
For the data on total assets ($ million) for the sample provided:
a. Calculate the mean.
b. Calculate the standard deviation.
c. Standardize the asset value of the third branch (find the z score). Interpret its meaning.
(Essay)
4.7/5 (32)
Which of the following best describes the difference between stem-and-leaf diagrams and histograms?
(Multiple Choice)
4.8/5 (37)
Data were collected on the hourly wage ($) for two types of marketing managers: (1) advertising / promotion managers and (2) sales managers. The results were used to create the histograms below. 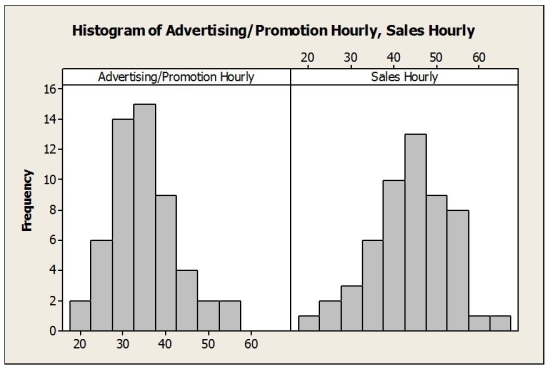 a. Describe the hourly wage distribution for advertising/promotion managers.
b. Describe the hourly wage distribution for sales managers.
c. Compare the hourly wages for the two types of marketing managers based on the histograms.
a. Describe the hourly wage distribution for advertising/promotion managers.
b. Describe the hourly wage distribution for sales managers.
c. Compare the hourly wages for the two types of marketing managers based on the histograms.
(Essay)
4.7/5 (40)
A sample of families with children at a local school is found to have a mean of 3.2 members per family. The mode number of family members is 2 and the median number is 2.0. Based on this information, which statement is true?
(Multiple Choice)
4.8/5 (37)
Filters
- Essay(0)
- Multiple Choice(0)
- Short Answer(0)
- True False(0)
- Matching(0)