Exam 22: Time Series Analysis
Exam 2: Data28 Questions
Exam 3: Surveys and Sampling28 Questions
Exam 4: Displaying and Describing Categorical Data32 Questions
Exam 5: Displaying and Describing Quantitative Data32 Questions
Exam 6: Scatterplots, Association, and Correlation32 Questions
Exam 7: Introduction to Linear Regression32 Questions
Exam 8: Randomness and Probability32 Questions
Exam 9: Random Variables and Probability Distributions28 Questions
Exam 10: Sampling Distributions28 Questions
Exam 11: Confidence Intervals for Proportions32 Questions
Exam 12: Testing Hypotheses About Proportions36 Questions
Exam 13: Confidence Intervals and Hypothesis Tests for Means36 Questions
Exam 14: Comparing Two Means32 Questions
Exam 15: Design of Experiments and Analysis of Variance Anova24 Questions
Exam 16: Inference for Counts: Chi-Square Tests26 Questions
Exam 17: Nonparametric Methods23 Questions
Exam 18: Inference for Regression32 Questions
Exam 19: Understanding Regression Residuals28 Questions
Exam 20: Multiple Regression22 Questions
Exam 21: Building Multiple Regression Models22 Questions
Exam 22: Time Series Analysis28 Questions
Exam 23: Decision Making and Risk32 Questions
Exam 24: Quality Control28 Questions
Exam 25: Exploring and Collecting Data28 Questions
Exam 26: Understanding Probability Distributions and Statistical Inference70 Questions
Exam 27: Exploring Relationships Among Variables40 Questions
Exam 28: Using Statistics for Decision Making26 Questions
Select questions type
Consider the following to answer the question(s) below:
Quarterly sales data (in $10,000) for a small company specializing in green cleaning products are shown in the time series graph below.  A seasonal regression model was fit to these data and the results are shown below.
  -Which of the following is (are) true?
Free
(Multiple Choice)
4.9/5  (26)
(26)
Correct Answer: Verified
E
A large automobile parts supplier keeps track of the demand for a particular part needed by its customers, automobile manufacturers. The time series plot below shows monthly demand for this part (in thousands) for a five-year period. The dominant component in this time series is 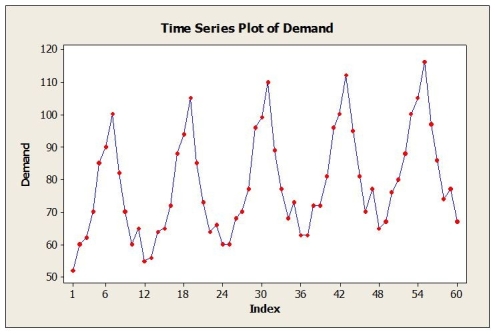
Free
(Multiple Choice)
4.9/5 (34)
Correct Answer:Verified
C
Consider the following to answer the question(s) below:
The following table shows actual sales values and forecasts.
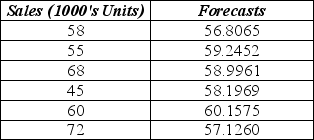 -The MAD for the forecasting method used is
Free
(Multiple Choice)
4.9/5 (31)
Correct Answer:Verified
A
If you suspect that your trend forecasting model may have autocorrelated forecast errors, it is appropriate to compute
(Multiple Choice)
4.9/5 (35)
Which of the following statistical measures is(are) used to help decision makers assess the potential for their model to provide usable forecasts?
(Multiple Choice)
4.8/5 (37)
Annual estimates of the population in the age group 65+ in a mid-sized city from 1999 (t = 1) onward are shown in the time series graph below.  a. Identify the dominant time series component(s) in the data.
b. Below are the results from fitting a linear trend model to the data. Use this model to estimate the 65+ population in this city for 2008 (t = 10).
a. Identify the dominant time series component(s) in the data.
b. Below are the results from fitting a linear trend model to the data. Use this model to estimate the 65+ population in this city for 2008 (t = 10). 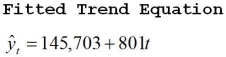 c. Below are the results from fitting a quadratic trend model to the data. Use this model to estimate the 65+ population in this city for 2008 (t = 10).
 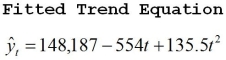 d. The actual population estimate for 2008 is 157,218. Which model does better? Why?
(Essay)
4.9/5 (38)
A company has recorded annual sales for the past 14 years and found the following linear trend model:  = 5.23 + 144.60 t. This means that
(Multiple Choice)
5.0/5 (34)
Consider the following to answer the question(s) below:
The following table shows actual sales values and forecasts.
-The MSE for the forecasting method used is
(Multiple Choice)
4.8/5 (31)
Monthly closing stock prices, adjusted for dividends, were obtained for Boeing Corporation from January 2006 through August 2008 (closing price on the first trading day of the month). The time series graph of these data is shown below. 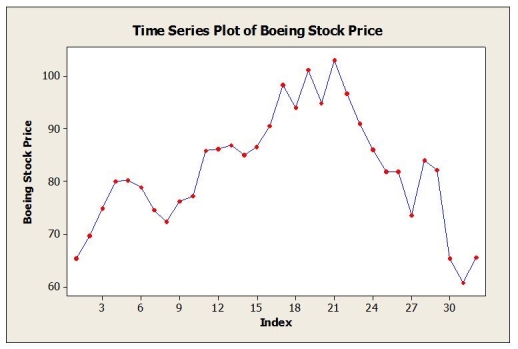 a. Below are the results of fitting a third-order autoregressive model, AR (3). Write out the model. Are the second and third lagged values significant? Explain.
  b. Below are the results of fitting a first-order autoregressive model, AR (1). Write out the model. Is this model typical for stock price data? Explain.
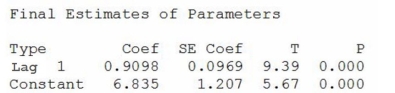
(Essay)
4.8/5 (41)
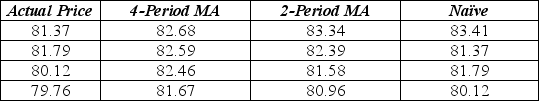
The table below shows the actual closing daily stock prices for Kyocera Corporation for September 2 through September 5, 2008, as well as 4-day moving average, 2-day moving average and naïve forecasts. Calculate the MAD and MSE for each of the three types of forecasts. Which is the best?
(Essay)
4.9/5 (35)
Consider the following to answer the question(s) below:
A third-order autoregressive model, AR (3) was fit to monthly closing stock prices, adjusted for dividends, of Boeing Corporation from January 2006 through August 2008 (closing price on the first trading day of the month). The results are as follows: 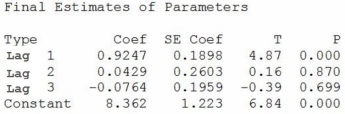 -Which of the following is true about index numbers? Index numbers are
(Multiple Choice)
4.7/5 (26)
Consider the following to answer the question(s) below:
Quarterly sales data (in $10,000) for a small company specializing in green cleaning products are shown in the time series graph below. A seasonal regression model was fit to these data and the results are shown below.
-The regression coefficients in the seasonal regression model indicate that
(Multiple Choice)
4.9/5 (39)
Quarterly sales data (in $10,000) for a small company specializing in green cleaning products are shown in the time series graph below. 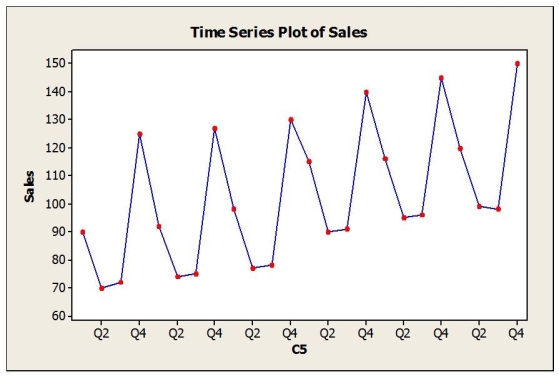 A seasonal regression model was fit to these data and the results are shown below.
 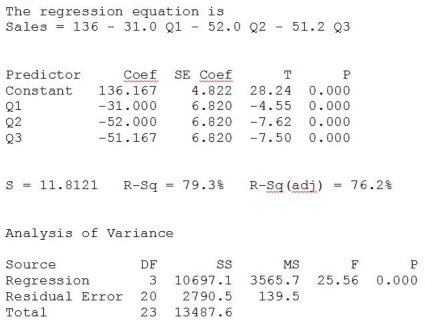 a. Is the seasonal regression model significant overall? Explain.
b. Interpret the regression coefficients in this model.
c. Use this model to provide forecasts for each of the four quarters of the next year.
a. Is the seasonal regression model significant overall? Explain.
b. Interpret the regression coefficients in this model.
c. Use this model to provide forecasts for each of the four quarters of the next year.
(Essay)
4.8/5 (26)
Consider the following to answer the question(s) below:
Annual estimates of the population in a certain city from 1999 (t = 1) onward are shown in the time series graph below. 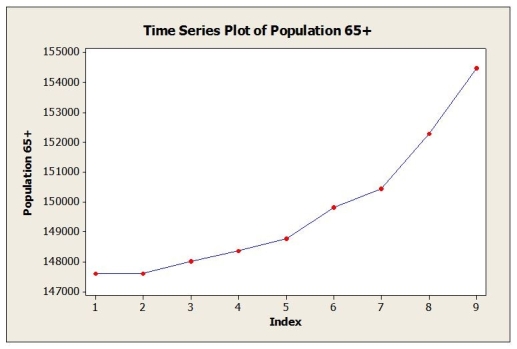 -The forecasting method that will most likely be best for this time series is
(Multiple Choice)
4.7/5 (33)
Consider the following to answer the question(s) below:
The quarterly sales of all types of bicycles sold at a small sporting goods store in Charlottetown for the 16 quarters from January 2005 to December 2008 are depicted in the time series graph below. 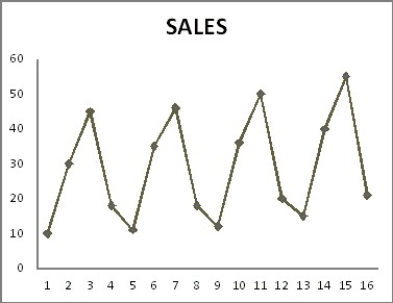
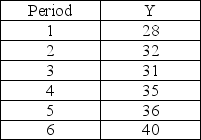
 -A time series is shown below. Perform single exponential smoothing for this data set using α = 0.2. What is the value of the forecast for period 6?
(Multiple Choice)
5.0/5 (32)
Annual estimates of the population in a certain city from 1999 (t = 1) onward are shown in the time series graph below. 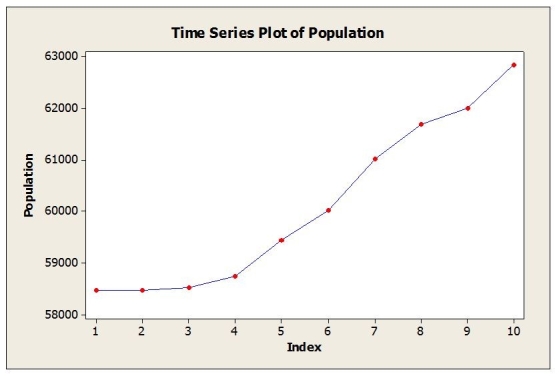 a. Identify the dominant time series component(s) in the data.
b. Below are the results from fitting a linear trend model to the data. Use this model to estimate the population in this city for 2008 (t = 10).
a. Identify the dominant time series component(s) in the data.
b. Below are the results from fitting a linear trend model to the data. Use this model to estimate the population in this city for 2008 (t = 10). 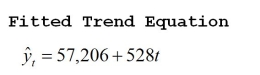 c. Below are the results from fitting a quadratic trend model to the data. Use this model to estimate the population in this city for 2008 (t = 10).
 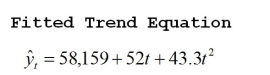 d. The actual population estimate for 2008 is 62,828. Which model does better? Why?
(Essay)
4.8/5 (37)
Consider the following to answer the question(s) below:
A third-order autoregressive model, AR (3) was fit to monthly closing stock prices, adjusted for dividends, of Boeing Corporation from January 2006 through August 2008 (closing price on the first trading day of the month). The results are as follows:
-The estimated model is
(Multiple Choice)
4.7/5 (36)
Consider the following to answer the question(s) below:
A company has developed a linear trend model to forecast monthly sales. The following data show the actual sales and the "fitted" sales for months 1-12.
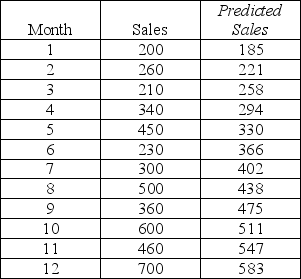 -Based on these data, what is the mean square error (MSE) for the linear trend model?
(Multiple Choice)
4.8/5 (37)
Consider the following to answer the question(s) below:
A third-order autoregressive model, AR (3) was fit to monthly closing stock prices, adjusted for dividends, of Boeing Corporation from January 2006 through August 2008 (closing price on the first trading day of the month). The results are as follows:
-Which of the following statements is true?
(Multiple Choice)
4.8/5 (43)
Daily closing stock prices for Kyocera Corporation were obtained from August 3, 2008 through August 23, 2008 and appear in the time series graph below. 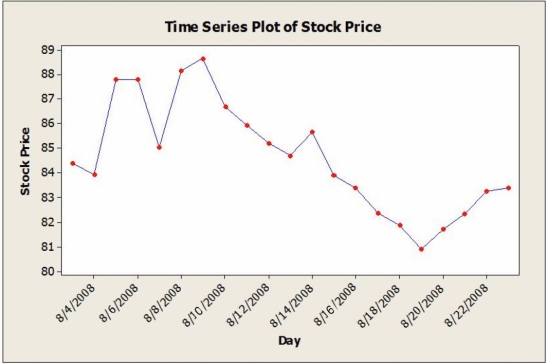 a. Identify the dominant time series component(s) in the data.
b. The method of moving averages was applied to these data. Below are time series graphs showing moving average results using two different values of L. In which application is a larger value of L used?
I.
a. Identify the dominant time series component(s) in the data.
b. The method of moving averages was applied to these data. Below are time series graphs showing moving average results using two different values of L. In which application is a larger value of L used?
I. 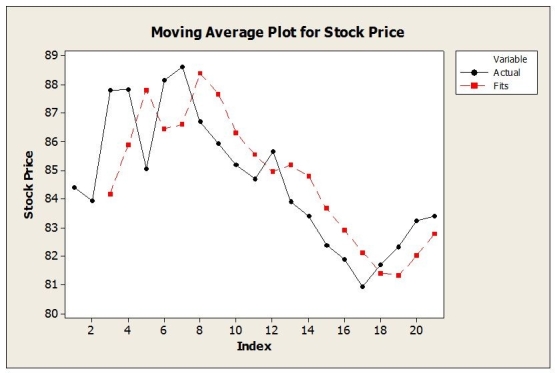 ii.
ii. 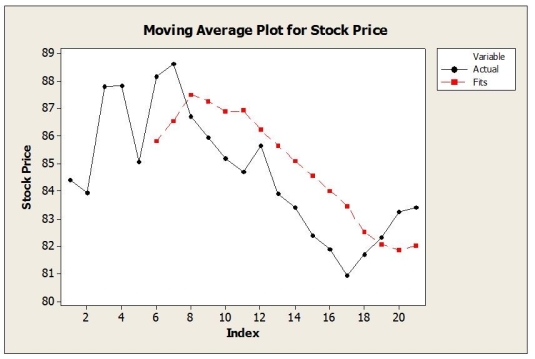 c. Suppose that the single exponential smoothing (SES) model was applied to these data. Below are time series graphs showing SES results using two different smoothing constants (α = 0.2 and α = 0.8). In which application is a larger value of α used?
I.
c. Suppose that the single exponential smoothing (SES) model was applied to these data. Below are time series graphs showing SES results using two different smoothing constants (α = 0.2 and α = 0.8). In which application is a larger value of α used?
I. 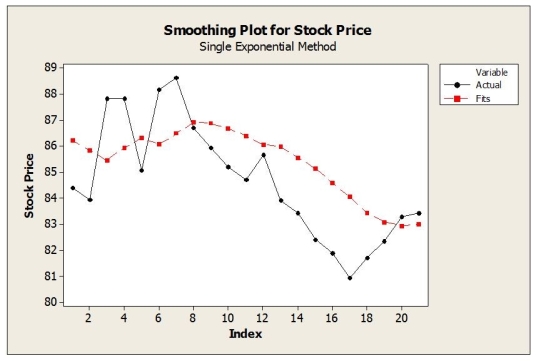 ii.
ii. 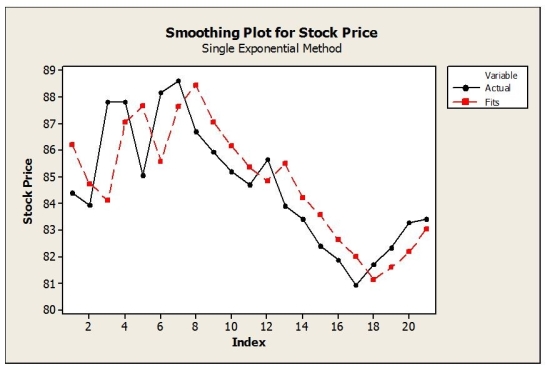
(Essay)
4.8/5 (39)
Filters
- Essay(0)
- Multiple Choice(0)
- Short Answer(0)
- True False(0)
- Matching(0)