Exam 21: Building Multiple Regression Models
Exam 2: Data28 Questions
Exam 3: Surveys and Sampling28 Questions
Exam 4: Displaying and Describing Categorical Data32 Questions
Exam 5: Displaying and Describing Quantitative Data32 Questions
Exam 6: Scatterplots, Association, and Correlation32 Questions
Exam 7: Introduction to Linear Regression32 Questions
Exam 8: Randomness and Probability32 Questions
Exam 9: Random Variables and Probability Distributions28 Questions
Exam 10: Sampling Distributions28 Questions
Exam 11: Confidence Intervals for Proportions32 Questions
Exam 12: Testing Hypotheses About Proportions36 Questions
Exam 13: Confidence Intervals and Hypothesis Tests for Means36 Questions
Exam 14: Comparing Two Means32 Questions
Exam 15: Design of Experiments and Analysis of Variance Anova24 Questions
Exam 16: Inference for Counts: Chi-Square Tests26 Questions
Exam 17: Nonparametric Methods23 Questions
Exam 18: Inference for Regression32 Questions
Exam 19: Understanding Regression Residuals28 Questions
Exam 20: Multiple Regression22 Questions
Exam 21: Building Multiple Regression Models22 Questions
Exam 22: Time Series Analysis28 Questions
Exam 23: Decision Making and Risk32 Questions
Exam 24: Quality Control28 Questions
Exam 25: Exploring and Collecting Data28 Questions
Exam 26: Understanding Probability Distributions and Statistical Inference70 Questions
Exam 27: Exploring Relationships Among Variables40 Questions
Exam 28: Using Statistics for Decision Making26 Questions
Select questions type
Consider the following to answer the question(s) below:
A sample of 30 companies was randomly selected for a study investigating what factors affect the size of company bonuses. Data were collected on the number of employees at the company and whether or not the employees were unionized (1 = yes, 0 = no). The following multiple regression model was fit to the data.  -The estimated regression model is
Free
(Multiple Choice)
4.8/5  (31)
(31)
Correct Answer: Verified
A
Consider the following to answer the question(s) below:
A sample of 30 companies was randomly selected for a study investigating what factors affect the size of company bonuses. Data were collected on the number of employees at the company and whether or not the employees were unionized (1 = yes, 0 = no). The following multiple regression model was fit to the data.
-The correct interpretation of the regression coefficient of Union is
Free
(Multiple Choice)
4.9/5 (38)
Correct Answer:Verified
D
Consider the following to answer the question(s) below:
A Toronto accounting firm estimated a model to explain variation in client profitability. The dependent variable is client net profits and the predictor variables include the hours spent working on the client and indicator variables to denote the type of client-manufacturing, service, or government. The indicator variables have a value of one if the client is the type described. The following are the model results.
 -At α = 0.05, which of the following statements is correct?
Free
(Multiple Choice)
4.8/5 (38)
Correct Answer:Verified
E
What does the scatterplot of these data (shown below) suggest? 
(Multiple Choice)
4.8/5 (34)
A sample of 30 companies was randomly selected for a study investigating what factors affect the size of company bonuses. Data were collected on the number of employees at the company and whether or not the employees were unionized (1 = yes, 0 = no). Below are the multiple regression results. 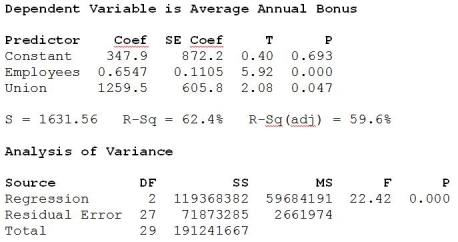 a. Write out the estimated regression equation.
b. Are all of the independent variables significant in this regression equation (using α = 0 .05)? Explain.
c. Interpret the coefficient of the Union.
d. Based on the scatterplot below, do you think using Union as an indicator variable in this model is appropriate? Explain.
a. Write out the estimated regression equation.
b. Are all of the independent variables significant in this regression equation (using α = 0 .05)? Explain.
c. Interpret the coefficient of the Union.
d. Based on the scatterplot below, do you think using Union as an indicator variable in this model is appropriate? Explain. 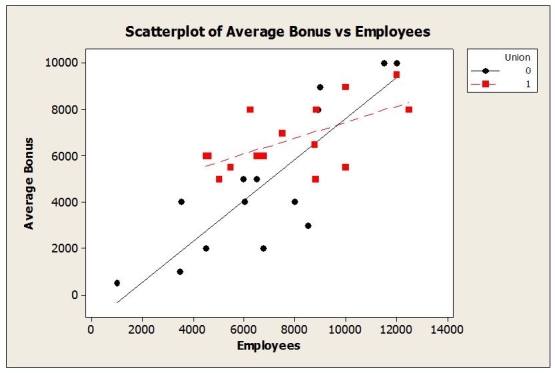 e. An alternative multiple regression model is fit to these data and the results are shown below. Which model is better? Explain.
 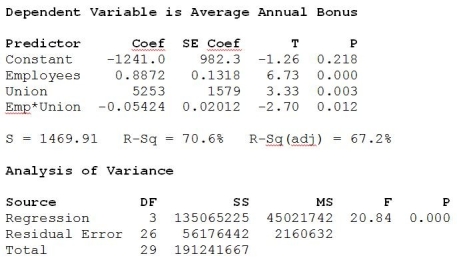 f. Using the better model, predict the annual average bonus for a company with 7500 employees that are not unionized.
(Essay)
4.8/5 (45)
Using this model, the predicted turnover rate for a firm in the financial services sector with 1000 employees, an innovativeness index of 50, and 2% job growth rate is
(Multiple Choice)
4.8/5 (29)
A regression equation that predicts the price of homes in thousands of dollars is  t = 24.6 + 0.055x1 - 3.6x2, where x2 is an indicator variable that represents whether the house is on a busy street (1 = yes, 0 = no). Based on this information, which of the following statements is true?
(Multiple Choice)
4.8/5 (31)
A sample of firms was selected from the high tech industry (Industry = 1) and the financial services sector (Industry = 0). Data were collected on the following variables: turnover rate, job growth, number of employees, and innovative index (higher scores indicate a more innovative and creative organizational culture). Below are the multiple regression results. 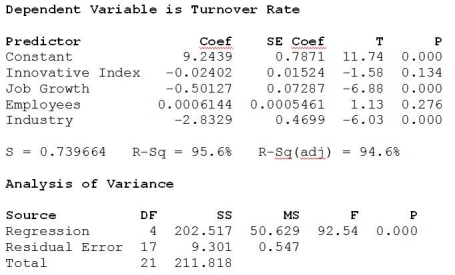 a. Write out the estimated regression equation.
b. Are all of the independent variables significant in this regression equation (using α = 0.05)? Explain.
c. Interpret the coefficient of the Industry.
d. An alternative multiple regression model is fit to these data and the results are shown below. Which model is better? Explain.
a. Write out the estimated regression equation.
b. Are all of the independent variables significant in this regression equation (using α = 0.05)? Explain.
c. Interpret the coefficient of the Industry.
d. An alternative multiple regression model is fit to these data and the results are shown below. Which model is better? Explain.  e. Based on the scatterplot below, is it appropriate to use Industry as an indicator variable in this regression model? Explain.
 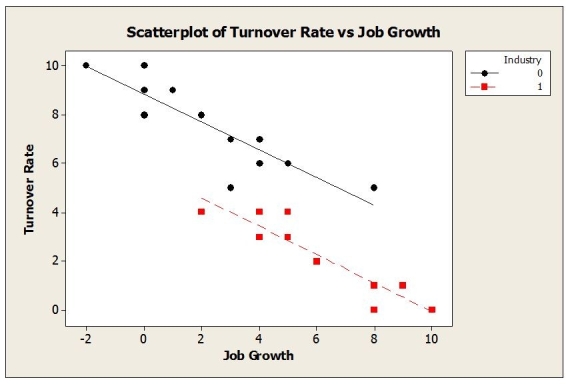 f. Using the better model, predict turnover rate for a firm in the financial services sector with 1000 employees, an innovative index of 50 and 2% job growth rate.
(Essay)
4.8/5 (29)
Consider the following to answer the question(s) below:
A sample of firms was selected from the high tech industry (Industry = 1) and the financial services sector (Industry = 0). Data were collected on the following variables: turnover rate, job growth, number of employees, and innovative index (higher scores indicate a more innovative and creative organizational culture). Below are the multiple regression results.  -Which of the following independent variables are significant in this regression equation at α = 0.05?
(Multiple Choice)
4.8/5 (33)
Consider the following to answer the question(s) below:
An alternative multiple regression model is fit to the data on the sample of firms selected from the high tech industry (Industry = 1) and the financial services sector (Industry = 0). The results are shown below. 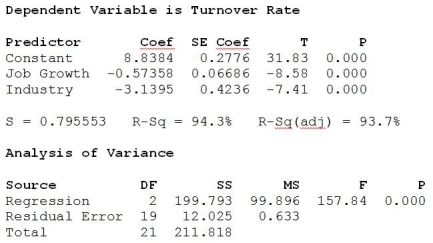 -Which of the following statements is true?
(Multiple Choice)
4.8/5 (25)
Consider the following to answer the question(s) below:
A sample of firms was selected from the high tech industry (Industry = 1) and the financial services sector (Industry = 0). Data were collected on the following variables: turnover rate, job growth, number of employees, and innovative index (higher scores indicate a more innovative and creative organizational culture). Below are the multiple regression results.
-How much of the variability in Turnover Rate is explained by the multiple regression model?
(Multiple Choice)
4.9/5 (29)
Consider the following to answer the question(s) below:
A sample of 30 companies was randomly selected for a study investigating what factors affect the size of company bonuses. Data were collected on the number of employees at the company and whether or not the employees were unionized (1 = yes, 0 = no). The following multiple regression model was fit to the data.
-At α = 0.05, we can conclude that
(Multiple Choice)
4.8/5 (34)
Consider the following to answer the question(s) below:
Consider the following scatter plot: 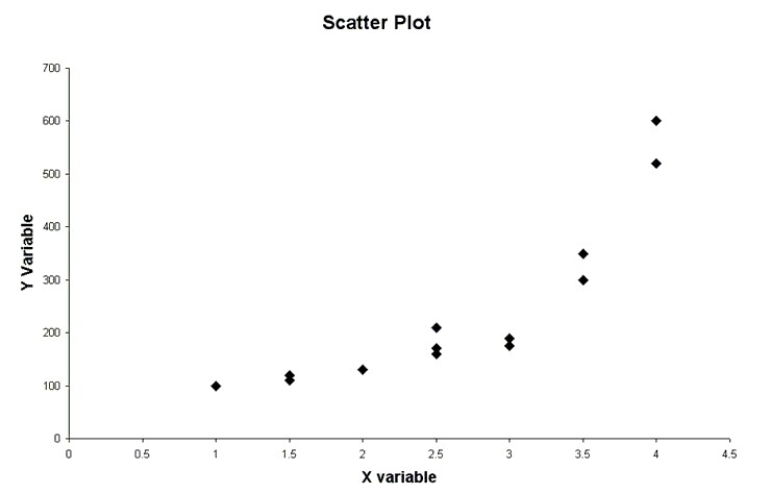 -What does the scatter plot suggest?
(Multiple Choice)
4.9/5 (44)
Consider the following to answer the question(s) below:
Consider the following scatter plot:
-The model of this data would be better fit with the inclusion of
(Multiple Choice)
5.0/5 (32)
Which of the following statements about multiple regression model building methods is true?
(Multiple Choice)
4.8/5 (36)
Consider the following to answer the question(s) below:
Consider the following scatter plot:
-Which of the following statements best describes a point with high leverage?
(Multiple Choice)
5.0/5 (39)
Consider the following to answer the question(s) below:
A Toronto accounting firm estimated a model to explain variation in client profitability. The dependent variable is client net profits and the predictor variables include the hours spent working on the client and indicator variables to denote the type of client-manufacturing, service, or government. The indicator variables have a value of one if the client is the type described. The following are the model results.
 -If the number of hours spent on a client is 100, and the client is in the Service industry,what is the predicted net profit?
(Multiple Choice)
4.8/5 (30)
Which of the following statements describes the consequences of collinearity in a model?
(Multiple Choice)
4.8/5 (41)
The editors of a national automotive magazine recently studied 30 different automobiles sold in the Canada with the intent of seeing whether they could develop a multiple regression model to explain the variation in highway fuel consumption. A number of different independent variables were collected. Included in these were two variables described as follows:  If these two variables are to be included in a regression model, how many additional indicator variables will be needed?
(Multiple Choice)
4.9/5 (38)
Filters
- Essay(0)
- Multiple Choice(0)
- Short Answer(0)
- True False(0)
- Matching(0)